Boards & Commissions Hybrid Meeting Pilot Program Hybrid Meeting Pilot Program rules • Presiding officer & second officer must be physically present at City Hall (Chair, Vice Chair, &/Secretary) • A quorum (6 members) must be physically present • Public testimony must be in person • Staff liaisons (Kaela & Liz) will be physically present Technical requirements for remote participation • Must be clearly visible & have two-way communication throughout the entire meeting • If audio or video communication is lost for any portion of the meeting, the remote participant is considered absent during that time. COVID-19 Safety Protocols • Only 7 commission members physically present • Empty dais seats between each member when possible • Staff and visitors are required to wear masks while on City property • Disposable masks will be provided to anyone who is not wearing proper face coverings • Public attendees will be socially distanced • To limit the number of people physically present, staff presenters will attend remotely • Hand sanitizer stations throughout Council Chamber • Lysol wipes for members Preparing for Hybrid Meetings • Communication is key. Please let liaison know as soon as possible if you cannot attend a meeting, need to recuse, etc. • Fill out survey • Seven members in person • Up to four members may participate remotely • Number will change depending on absences, recusals, etc.
Refresher on Boards & Commissions rules Attendance requirements What constitutes an excused absence? • Injury or illness of a member • Illness or injury to an immediate family member • Active military service • Birth/adoption of a child (for up to 90s days after) • Must be reported in advance of the next meeting Late/partial attendance • Notify liaison in advance if you will be late or need to recuse on an item • Must be present for ¾ of the meeting & not cause the commission to break quorum on any action items • New rules require remote participants to be visible & have 2-way communication the entire meeting. Any technical issues/visibility issues may result in an unexcused absence. Meeting cancellations • If a meeting is cancelled due to lack of a quorum, unexcused absences are still counted. • A cancellation notice will be posted including: • Members that planned to attend • Absent members Attendance violations • Unexcused absences for three consecutive meetings • Missing 1/3 (seven) of all regular meetings in a 12- month timeframe • Violations are reported to the Clerk’s Office • BC Coordinator notifies the nominating Council Member of their options: • Provide an attendance waiver; or • An automatic vacancy occurs that requires a new appointment. Citizen Communication • Residents may sign up to speak on general items for three minutes discussion. • General citizen communication is not posted for • Members may ask clarifying questions only • May ask staff to report back Citizen Communication • Residents may sign up to speak on all agenda items except for Staff Briefings. • No public testimony can be made after the public hearing is closed. • Example: hearing” • Member 1: “Chair, I move to close the public • Member 2: “Second” • Chair: “All in favor, say aye (or raise your hand)” New business – Future Agenda Items • Members may include an item if: • Sponsorship is received from two or more members • Outside of a meeting, members may also request the Chair to include an item on a future agenda • Approval is at the Chair’s discretion • Copy Kaela on all requests • Will be placed on next available agenda Things to know • The City Code prohibits boards and commissions from meeting in closed session unless they have received prior approval from the city attorney. Things to know …
Purview of the Environmental Commission August 25, 2021 Retreat City Code 2-1-144: Environmental Commission The commission is empowered to: REVIEW & ANALYZE ACT PROMOTE the policies relating to the environmental quality of the city as an advisory board to the city council, the city manager, and the department in their efforts to oversee the protection and integrity of the natural environment growth management and land use planning, minimize degradation of water resources, protect downstream areas, and promote recreation opportunities and environmental awareness ADVISE & RECOMMEND on any issue which the commission determines necessary or advisable for the enhancement and stewardship of the urban forest both public and private. 2-1-144 – Section G assist the city council, the city manager, and the department in studying, promoting and enforcing environmental protection policies to assure the health, safety, welfare and quality of life of all residents within the City's incorporated boundaries as well as those within its extraterritorial jurisdiction where the boundaries apply. 2-1-144 – Section H The commission shall advise on… Beautification Recreation resources Public education on environmental matters Construction controls for erosion & sedimentation Hazardous waste materials management City environmental policies re. monitoring & enforcement Revegetation & landscaping Solid waste disposal plan alternatives Air quality Water quality Growth management Land use planning Watershed protection Roadway planning Noise abatement All matters pertaining to the City’s urban forest, including public & private trees 2-1-144 – Section (I) The commission shall review: variances to requirements for water quality protection Monitoring of storm water runoff in developed & undeveloped areas Efficiency of existing and proposed structural & nonstructural water quality controls Effectiveness of Chapter 25-4 (Subdivision) Waste treatment permits within city’s ETJ Policies & programs for flood control, erosion control, & water quality Capital improvement projects Municipal utility district proposals & amendments Roadway plan amendments Recommend urban runoff standards Environmental elements of planned unit developments (PUDs) 2-1-144 – Section J & K The commission may recommend & initiate, with the advice and consent of city council, specific project studies concerning any matters described in Subsections (H) and (I), or any other related environmental or urban forestry issue. The commission shall make reports and recommendations for standards and criteria concerning any of these matters as well. 2-1-144 – Section L The commission shall promote close cooperation between the City and all private residents, institutions, and agencies interested in or conducting natural resource, environmental activities, so that …
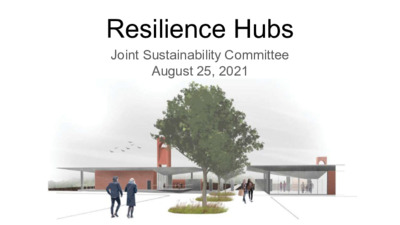
Resilience Hubs Joint Sustainability Committee August 25, 2021 Equity Issue: All recent extreme weather events (Halloween/Memorial Day floods, heatwaves, Winter Storm Uri, etc.) have hit low income communities and communities of color first and worst Moving Forward ● Center low income communities and communities of color in these planning processes ● Build an equity lens for all staff participating in these processes ● Move as much as possible towards Community Leadership and Ownership of the work Council Resolution 20210408-028 Plan: Deliverable: ● Conduct an assessment to identify potential locations for resilience hubs. ● Explore "passive survivability", redundant power and water. ● Engagement with each community, center the needs of the most vulnerable and affected community members. ● Potential resilience hubs are based on 15-minute walkshed of each neighborhood. ● Budget sufficient to fund recommendations and strategies to design and equip hubs. ● Plan, budget recommendations, funding strategies, and a timeline for designing and equipping an initial six pilot hubs for disasters. ● Intergovernmental memoranda necessary to memorialize community partnerships necessary to create resilience hubs.” Reimagining Public Safety - Neighborhood Hubs 10 Neighborhoods - that meet these criteria 1. Over policing, concentrated surveillance, and Recommendation: $2.5 million - 5 X $500k (staffing, administration, and programming) 2. 3. 4. 5. 6. 7. 8. 9. 10. 11. 12. patrol data Calls to 211 by Zip Code & Call Type Unemployment and underemployment rates Poverty and low-income neighborhoods Central Health Focus Areas Housing insecurity Areas vulnerable to flooding Areas lacking tree canopy coverage Neighborhoods near brownfields, landfills, recycling, and wastewater treatment facilities Food insecurity Predatory lender locations COVID-19 new cases, mortality rates, testing availability, and vaccine access - - - - - Drop-in center & outreach base. Created and staffed by neighborhood. Community members determine needs to be addressed & resources needed. City-run Neighborhood Centers exist in some communities, but they are not meeting community needs & residents do not feel safe accessing them. Idea is that they are community “owned” and run. Could these also serve as Resilience Hubs? 98% of the time a Neighborhood Hub 2% of the time a Resilience Hub GAVA Press Release: Uri Response Resilience Hubs and neighborhood centers must be supplied with critical on-site materials and resources, now: ● Generators and power banks ● Walkie Talkies and transistor radios ● Hard landlines for first responders and community responders in each hub First aid, medical (including OTC inventory and …
Rodriguez, Lisa From: Sent: To: Subject: HPD ICRC Commissioners Wednesday, August 25, 2021 10:50 AM HPD ICRC Commissionsers DL FW: new districts From: Kim Lanzillotti < Sent: Wednesday, August 25, 2021 3:49:30 PM (UTC+00:00) Monrovia, Reykjavik To: HPD ICRC Commissioners <ICRC.Commissioners@austintexas.gov> Subject: new districts > *** External Email - Exercise Caution *** Dear Members of the ICRC Commission, I am a resident in the South River City Citizens neighborhood association. When the city first divided the city into individual city council districts our area of SRCC was put in district 3 and the rest of our neighborhood was in district 9. This is problematic when we have issues affecting our neighborhood, because we are not represented by the same person on the city council. Living in south central Austin, our issues are different from those affecting east Austin and I feel we have not had sufficient representation. I believe we would have better representation if our neighborhood was in the same district. Now that the districts are being redrawn I would like to request that area 8 be included in the same district as the other areas of SRCC. Thank you, Kim Lanzillotti 78704 CAUTION: This email was received at the City of Austin, from an EXTERNAL source. Please use caution when clicking links or opening attachments. If you believe this to be a malicious and/or phishing email, please forward this email to cybersecurity@austintexas.gov. 1
Rodriguez, Lisa From: Sent: To: Subject: HPD ICRC Commissioners Thursday, August 26, 2021 8:48 AM HPD ICRC Commissionsers DL FW: District 9 > ________________________________________ From: Kimberly Levinson < Sent: Thursday, August 26, 2021 1:47:49 PM (UTC+00:00) Monrovia, Reykjavik To: HPD ICRC Commissioners Subject: District 9 *** External Email ‐ Exercise Caution *** To the Committee: My name is Kimberly Levinson, and I want to make sure you understand that I speak only for myself, despite leading the PAC and DANA this year. My concern is to create a district that reflects the true character of District 9 and keeps communities of interest together as much as possible. First, I think the Capital belongs in District 9. That is a huge part of Downtown, and carving it out makes little sense to me. Development around it is clearly a huge part of further developing the Downtown area, and the district lines should reflect that. Second, I think the area that is currently in District 1, but is on the west side of I‐35, should be included in District 9 on the principle that communities should be kept together, and those buildings are clearly part of Downtown. Moving them into District 9 will also help maintain the current character and demographic mix of District 1, which is part of the ICRC's concerns. Third, I believe the southwest part of District 9, in the Bouldin area and points west from there, should be removed from the Downtown district. That area should be joined with other parts of south Austin, as their community interests are more aligned, and District 9 has grown large enough to need to remove at least some areas, especially if you consider my final point. Finally, I believe there is a case to be made for adding the areas east of I‐35 from E 7th Street down to East Cesar Chavez into District 9. Those areas are effectively merging with downtown, becoming more urban, and becoming more gentrified. Therefore, they have a common community interest in the development of the Downtown area, and their inclusion in District 9 and their removal from District 3 will help maintain the character and demographic mix of District 3, which is also a goal of this redistricting process. Thank you for considering my points, and for all the work I know you are putting into this. Warmest regards, Kimberly Levinson 1 CAUTION: This email …
Rodriguez, Lisa From: Sent: To: Subject: Attachments: HPD ICRC Commissioners Wednesday, August 25, 2021 7:54 AM HPD ICRC Commissionsers DL FW: Parsons Letter to 10-1 Commissioners (w/attachments) (1 of 2) Parsons ICRC Letter 08-24-21.pdf From: Dugan, Matthew <Matthew.Dugan@austintexas.gov> Sent: Wednesday, August 25, 2021 12:54:18 PM (UTC+00:00) Monrovia, Reykjavik To: HPD ICRC Commissioners <ICRC.Commissioners@austintexas.gov> Subject: FW: Parsons Letter to 10-1 Commissioners (w/attachments) (1 of 2) > From: Brad Parsons Sent: Tuesday, August 24, 2021 9:15 PM To: Puentes, Christina ‐ BC <BC‐Christina.Puentes@austintexas.gov>; Gonzalez, Luis ‐ BC <BC‐ Luis.Gonzalez@austintexas.gov>; Lands, Sterling ‐ BC <BC‐Sterling.Lands@austintexas.gov>; Le, Hoang ‐ BC <BC‐ Hoang.Le@austintexas.gov>; Blank, Joshua ‐ BC <BC‐Joshua.Blank@austintexas.gov>; Hardin, Errol ‐ BC <BC‐ Errol.Hardin@austintexas.gov>; Yee, Selina ‐ BC <BC‐Selina.Yee@austintexas.gov>; Kambo, Shaina ‐ BC <BC‐ Shaina.Kambo@austintexas.gov>; Kannan, Prabhu ‐ BC <BC‐Prabhu.Kannan@austintexas.gov>; bc‐ brigham.morris@austintexas.gov; Dempsey, Erin ‐ BC <BC‐Erin.Dempsey@austintexas.gov>; Falcon, Camellia ‐ BC <BC‐ Camellia.Falcon@austintexas.gov>; Schneider, Eugene ‐ BC <BC‐Eugene.Schneider@austintexas.gov>; bc‐sara.ines‐ calderon@austintexas.gov; bc‐sara.inescalderon@austintexas.gov Cc: Dugan, Matthew <Matthew.Dugan@austintexas.gov> Subject: Parsons Letter to 10‐1 Commissioners (w/attachments) (1 of 2) *** External Email - Exercise Caution *** (See attachments) Tuesday, August 24, 2021 Greetings ICRC Commissioners! I noticed the video of your last meeting just posted on the City webpage, day before yesterday. Particularly, what stood out to me is that Mr. Korbel is going to draft your map and then take feedback from you all as a group and then individually after he has drafted the 10 districts map and before that Preliminary Map is released for public comment in the middle of September. 1 I had assumed like the last 10-1 Commission that you all would be having an open public meeting with your mapper and giving him direction on the layout of the map, as he drew it, as opposed to delegating the drafting of the 10 district map to your mapper and then give him feedback on that afterward. I had thought that you all might have watched the videos of the days when the last 10-1 Commission worked with their mapper to draw both their Preliminary map and their Final map, but just now checking, I see that the City of Austin has taken down those ATXN videos showing the mapper working with the last 10-1 Commission at AE’s Town Lake Center and One Texas Center. See: 1. http://www.austintexas.gov/edims/document.cfm?id=198360 2. http://www.austintexas.gov/edims/document.cfm?id=197729 3. http://www.austintexas.gov/edims/document.cfm?id=200533 4. http://www.austintexas.gov/edims/document.cfm?id=200802 and 5. http://www.austintexas.gov/edims/document.cfm?id=203067 . If this is to be the case, then I think you should give some detailed direction …
Rodriguez, Lisa From: Sent: To: Subject: Attachments: HPD ICRC Commissioners Wednesday, August 25, 2021 7:54 AM HPD ICRC Commissionsers DL FW: Parsons Letter to 10-1 Commissioners (w/attachments) (2 of 2) 2020AustinDemogpcts.jpg; 2020AustinAsians.jpg; 2020AustinBlacks.jpg; 2020AustinHispanics.jpg From: Dugan, Matthew <Matthew.Dugan@austintexas.gov> Sent: Wednesday, August 25, 2021 12:54:22 PM (UTC+00:00) Monrovia, Reykjavik To: HPD ICRC Commissioners <ICRC.Commissioners@austintexas.gov> Subject: FW: Parsons Letter to 10-1 Commissioners (w/attachments) (2 of 2) From: Brad Parsons < Sent: Tuesday, August 24, 2021 9:33 PM To: Puentes, Christina ‐ BC <BC‐Christina.Puentes@austintexas.gov>; Gonzalez, Luis ‐ BC <BC‐ Luis.Gonzalez@austintexas.gov>; Lands, Sterling ‐ BC <BC‐Sterling.Lands@austintexas.gov>; Le, Hoang ‐ BC <BC‐ Hoang.Le@austintexas.gov>; Blank, Joshua ‐ BC <BC‐Joshua.Blank@austintexas.gov>; Hardin, Errol ‐ BC <BC‐ Errol.Hardin@austintexas.gov>; Yee, Selina ‐ BC <BC‐Selina.Yee@austintexas.gov>; Kambo, Shaina ‐ BC <BC‐ Shaina.Kambo@austintexas.gov>; Kannan, Prabhu ‐ BC <BC‐Prabhu.Kannan@austintexas.gov>; bc‐ brigham.morris@austintexas.gov; Dempsey, Erin ‐ BC <BC‐Erin.Dempsey@austintexas.gov>; Falcon, Camellia ‐ BC <BC‐ Camellia.Falcon@austintexas.gov>; Schneider, Eugene ‐ BC <BC‐Eugene.Schneider@austintexas.gov>; Calderon, Sara ‐ BC <BC‐Sara.Calderon@austintexas.gov> Cc: Dugan, Matthew <Matthew.Dugan@austintexas.gov> Subject: Parsons Letter to 10‐1 Commissioners (w/attachments) (2 of 2) *** External Email - Exercise Caution *** (See attachments) Tuesday, August 24, 2021 Greetings ICRC Commissioners! I noticed the video of your last meeting just posted on the City webpage, day before yesterday. Particularly, what stood out to me is that Mr. Korbel is going to draft your map and then take feedback from you all as a group and then individually after he has drafted the 10 districts map and before that Preliminary Map is released for public comment in the middle of September. 1 I had assumed like the last 10-1 Commission that you all would be having an open public meeting with your mapper and giving him direction on the layout of the map, as he drew it, as opposed to delegating the drafting of the 10 district map to your mapper and then give him feedback on that afterward. I had thought that you all might have watched the videos of the days when the last 10-1 Commission worked with their mapper to draw both their Preliminary map and their Final map, but just now checking, I see that the City of Austin has taken down those ATXN videos showing the mapper working with the last 10-1 Commission at AE’s Town Lake Center and One Texas Center. See: 1. http://www.austintexas.gov/edims/document.cfm?id=198360 2. http://www.austintexas.gov/edims/document.cfm?id=197729 3. http://www.austintexas.gov/edims/document.cfm?id=200533 4. http://www.austintexas.gov/edims/document.cfm?id=200802 and 5. http://www.austintexas.gov/edims/document.cfm?id=203067 . If this is to be the case, then I think you should give some …
Rodriguez, Lisa From: Sent: To: Subject: HPD ICRC Commissioners Friday, August 27, 2021 11:52 AM HPD ICRC Commissionsers DL FW: Planned Public Forums & State Law Impact From: Joseph Reynolds Sent: Friday, August 27, 2021 4:51:43 PM (UTC+00:00) Monrovia, Reykjavik To: HPD ICRC Commissioners <ICRC.Commissioners@austintexas.gov> Subject: Planned Public Forums & State Law Impact *** External Email - Exercise Caution *** You should know that Sept 1 the Pandemic Exception for Public Meetings reverts to regular rules. Meetings must be in‐ person. There are details about quorum, etc. But change is coming. Joseph Reynolds CAUTION: This email was received at the City of Austin, from an EXTERNAL source. Please use caution when clicking links or opening attachments. If you believe this to be a malicious and/or phishing email, please forward this email to cybersecurity@austintexas.gov. 1
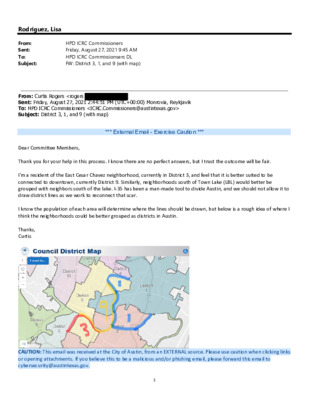
Rodriguez, Lisa From: Sent: To: Subject: HPD ICRC Commissioners Friday, August 27, 2021 9:45 AM HPD ICRC Commissionsers DL FW: District 3, 1, and 9 (with map) From: Curtis Rogers <rogers Sent: Friday, August 27, 2021 2:44:51 PM (UTC+00:00) Monrovia, Reykjavik To: HPD ICRC Commissioners <ICRC.Commissioners@austintexas.gov> Subject: District 3, 1, and 9 (with map) *** External Email - Exercise Caution *** Dear Committee Members, Thank you for your help in this process. I know there are no perfect answers, but I trust the outcome will be fair. I'm a resident of the East Cesar Chavez neighborhood, currently in District 3, and feel that it is better suited to be connected to downtown, currently District 9. Similarly, neighborhoods south of Town Lake (LBL) would better be grouped with neighbors south of the lake. I‐35 has been a man‐made tool to divide Austin, and we should not allow it to draw district lines as we work to reconnect that scar. I know the population of each area will determine where the lines should be drawn, but below is a rough idea of where I think the neighborhoods could be better grouped as districts in Austin. Thanks, Curtis CAUTION: This email was received at the City of Austin, from an EXTERNAL source. Please use caution when clicking links or opening attachments. If you believe this to be a malicious and/or phishing email, please forward this email to cybersecurity@austintexas.gov. 1
From: Sent: To: Subject: Attachments: HPD ICRC Commissioners Wednesday, August 25, 2021 3:28 PM HPD ICRC Commissionsers DL FW: ICRC citizen input on: (1) Commissioner Falcon's info request on census "undercount" by geographic area PXL_20210825_185426013.jpg Rodriguez, Lisa From: Philip Wiley < Sent: Wednesday, August 25, 2021 8:27:05 PM (UTC+00:00) Monrovia, Reykjavik To: HPD ICRC Commissioners <ICRC.Commissioners@austintexas.gov> Subject: ICRC citizen input on: (1) Commissioner Falcon's info request on census "undercount" by geographic area *** External Email - Exercise Caution *** Commissioners, In your August 18th meeting, during the City Demographer's presentation, an important question was asked that this may provide insight on. The Austin ‐ Travis County Census Strategy Map has the best data I have seen related to estimating census count success. Here is a link to the map, color coded based on response rate as of October 28th 2020. Again I am providing a Government asset posted publicly for your consideration:: https://www.arcgis.com/apps/webappviewer/index.html?id=66c1f6bdf2034bd898db56d964125573 West Campus Attached below is a map photo that shows the lowest response area in the City (28.8%) which is in West Campus, is also the densest housing tract in the city (Guadalupe / Rio Grande / MLK / 24th = Tract 6.08). The four other adjacent tracts that are primarily student housing all also had response rates below 50%. Likely the most stable and easiest to count / estimate tract was UT, which even showed a 6.8% decline in residents. Students working remotely from home in other cities during a pandemic created a unique census challenge. From what we know about the explosive growth of this area, it appears .low census response rates are correlated with population undercount. UT UNO ‐ NW UNO ‐ NE UNO ‐ SW UNO ‐ SE Eastern Crescent One might assume the eastern crescent was the second largest undercount area in the City based on census response rates, but also that all of the minority opportunity districts experienced more undercount than other districts. Undercount > D9, D1, D2, D3, D4. ‐6.8% 40.1% 11.9% 1.9% 129.2% 9207 3315 4478 4190 2306 8580 4645 5012 4268 5286 ‐627 1330 534 78 2980 6.01 6.05 6.06 6.07 6.08 1 Implications Likely ‐ some of the fastest growing parts / districts in the city also were the most undercounted. D10, which may be the slowest growing District in Austin, also had response rates >70%, >75%, >80%. Unless Districts are mapped at different sizes now, as …
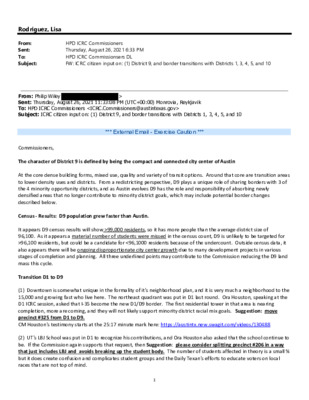
Rodriguez, Lisa From: Sent: To: Subject: HPD ICRC Commissioners Thursday, August 26, 2021 6:33 PM HPD ICRC Commissionsers DL FW: ICRC citizen input on: (1) District 9, and border transitions with Districts 1, 3, 4, 5, and 10 From: Philip Wiley Sent: Thursday, August 26, 2021 11:33:08 PM (UTC+00:00) Monrovia, Reykjavik To: HPD ICRC Commissioners <ICRC.Commissioners@austintexas.gov> Subject: ICRC citizen input on: (1) District 9, and border transitions with Districts 1, 3, 4, 5, and 10 > *** External Email - Exercise Caution *** Commissioners, The character of District 9 is defined by being the compact and connected city center of Austin At the core dense building forms, mixed use, quality and variety of transit options. Around that core are transition areas to lower density uses and districts. From a redistricting perspective, D9 plays a unique role of sharing borders with 3 of the 4 minority opportunity districts, and as Austin evolves D9 has the role and responsibility of absorbing newly densified areas that no longer contribute to minority district goals, which may include potential border changes described below. Census ‐ Results: D9 population grew faster than Austin. It appears D9 census results will show >99,000 residents, so it has more people than the average district size of 96,100. As it appears a material number of students were missed in the census count, D9 is unlikely to be targeted for >96,100 residents, but could be a candidate for <96,1000 residents because of the undercount. Outside census data, it also appears there will be ongoing disproportionate city center growth due to many development projects in various stages of completion and planning. All three underlined points may contribute to the Commission reducing the D9 land mass this cycle. Transition D1 to D9 (1) Downtown is somewhat unique in the formality of it's neighborhood plan, and it is very much a neighborhood to the 15,000 and growing fast who live here. The northeast quadrant was put in D1 last round. Ora Houston, speaking at the D1 ICRC session, asked that I‐35 become the new D1/D9 border. The first residential tower in that area is nearing completion, more are coming, and they will not likely support minority district racial mix goals. Suggestion: move precinct #325 from D1 to D9. CM Houston's testimony starts at the 25:17 minute mark here: https://austintx.new.swagit.com/videos/130488 (2) UT's LBJ School was put in D1 to recognize his contributions, and Ora Houston …
Rodriguez, Lisa From: Sent: To: Subject: Attachments: HPD ICRC Commissioners Friday, August 27, 2021 10:26 AM HPD ICRC Commissionsers DL FW: ICRC citizen input : (1) North and West Austin PXL_20210818_232416287.jpg; PXL_20210826_013028251.jpg; PXL_20210818_232527925.jpg; PXL_ 20210819_114536587.jpg From: Philip Wiley < Sent: Friday, August 27, 2021 3:24:22 PM (UTC+00:00) Monrovia, Reykjavik To: HPD ICRC Commissioners <ICRC.Commissioners@austintexas.gov> Subject: ICRC citizen input : (1) North and West Austin *** External Email - Exercise Caution *** Commissioners, Sincere thanks for any interest you may have shown related to my prior input. Hopefully this helps pull together key points from data presented (by others and myself) and public testimony.. I ask that you consider looking at a few maps you have seen already before but maybe not at the same time. Photos of 4 maps are attached, along with a descriptor and source link. Socio‐economic Map (housing prices) https://austintexas.gov/sites/default/files/files/Housing/Austin%20HMA final.pdf ANC Sector Map https://www.atxanc.org/copy‐of‐about Asian / Hispanic Geographic Distribution Maps http://www.austintexas.gov/edims/document.cfm?id=365926 http://www.austintexas.gov/edims/document.cfm?id=365928 My Observations for North and West Austin (defined as north of the lake, west of I‐35): People organize themselves in clusters, or bands, you can see it much clearer on demographic maps than the city district maps. (A) Primarily white, primarily higher income in a band close to the lake. "Waterfront prices" lead to other commonalities or communities of interest. On every map here. (B) Whether Koenig or Anderson is the divider, there are distinct minority concentrations north of there, Asian to the west, Hispanic in the central. (C) The current 10‐1 map (not shown) has more north / south orientation than the way the community organizes, which favors those with more resources to have their voice heard. General Recommendations with specific examples: 1 (D) View District 6 as the best chance at clustering people of Asian descent together. The north half of the district has a fairly large concentration, as does the north half of district 10. Recommendation: move district 326 from D10 to D6 in support of a higher Asian concentration in D6,, and evaluate other border opportunities (e.g. precincts 331, 328). You have heard people in north D10 testify they don't feel community links with 78703 = waterfront. (E) View District 10 as the waterfront district, extending out to the city's western border. As an example on the D6 / D10 shared border ‐ River Place in D6 is like asking UT and OU to share a row at a football …
1. 2. HISTORIC LANDMARK COMMISSION PRESERVATION PLAN COMMITTEE WEDNESDAY, AUGUST 25, 2021 – 10:30 a.m. VIA VIDEOCONFERENCING COMMISSION MEMBERS: Ben Heimsath X X Terri Myers Beth Valenzuela X MEETING NOTES CALL TO ORDER CITIZEN COMMUNICATION: GENERAL Speakers who register to speak no later than noon the day before the meeting will be allowed a three-minute allotment to address their concerns regarding items not posted on the agenda. APPROVAL OF MINUTES July 19, 2021 MOTION: Approve minutes from July 19, 2021 by Myers, Valenzuela seconds. VOTE: 2- 0, Heimsath absent. Commissioner Heimsath admitted to the meeting. DISCUSSION AND POSSIBLE ACTION A. Review criteria for success • Staff: Intended purpose is for general guidance, reference in plan development B. C. Committee feedback: • A good place to start • Consider condensing if possible, but ok if not • Who will measure success? Discuss topics for working group consideration (discussion combined with C) Discuss order of topics for working group meetings • Staff explained the process for sorting and organizing topic suggestions Committee feedback: • Ensure that how preservation relates to other laws, programs, etc. is clearly explained and reinforced throughout plan development process 1 Include community involvement under partnerships topic • • Consider what’s possible in existing legal and zoning framework; also consider what would be ideal Include funding opportunities and incentives • • Expand incentives to support preservation at all levels, for all groups • Expand education • Discuss disaster preparedness (e.g., flooding, fires) • Plan draft will not include an updated preservation ordinance, but the plan will likely require updates to the ordinance to be achieved • Discuss issues of integrity for community resources • Get working group input on topics list/meeting schedule Potential briefing to Historic Landmark Commission in September • The committee agreed a briefing would be helpful D. ADJOURNMENT MOTION: Adjourn the meeting by Myers, Valenzuela seconds. VOTE: 2-0, Heimsath off the dais. The City of Austin is committed to compliance with the American with Disabilities Act. Reasonable modifications and equal access to communications will be provided upon request. Meeting locations are planned with wheelchair access. If requiring Sign Language Interpreters or alternative formats, please give notice at least 2 days (48 hours) before the meeting date. Please call the Historic Preservation Office at 512-974-1686 for additional information; TTY users route through Relay Texas at 711. For more information on the Preservation Plan Committee, please contact Cara …