Item 4b-Late Backup-Amendment to Amendment_Lanetta Cooper — original pdf
Backup
Backup
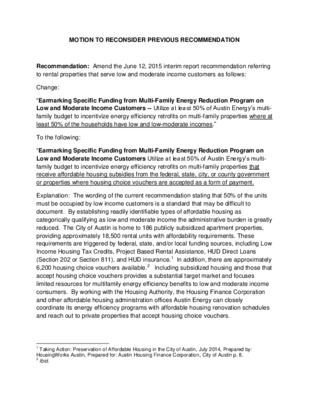
MOTION TO RECONSIDER PREVIOUS RECOMMENDATION Recommendation: Amend the June 12, 2015 interim report recommendation referring to rental properties that serve low and moderate income customers as follows: Change: “Earmarking Specific Funding from Multi-Family Energy Reduction Program on Low and Moderate Income Customers -- Utilize at least 50% of Austin Energy’s multi-family budget to incentivize energy efficiency retrofits on multi-family properties where at least 50% of the households have low and low-moderate incomes.” To the following: “Earmarking Specific Funding from Multi-Family Energy Reduction Program on Low and Moderate Income Customers Utilize at least 50% of Austin Energy’s multi-family budget to incentivize energy efficiency retrofits on multi-family properties that receive affordable housing subsidies from the federal, state, city, or county government or properties where housing choice vouchers are accepted as a form of payment. Explanation: The wording of the current recommendation stating that 50% of the units must be occupied by low income customers is a standard that may be difficult to document. By establishing readily identifiable types of affordable housing as categorically qualifying as low and moderate income the administrative burden is greatly reduced. The City of Austin is home to 186 publicly subsidized apartment properties, providing approximately 18,500 rental units with affordability requirements. These requirements are triggered by federal, state, and/or local funding sources, including Low Income Housing Tax Credits, Project Based Rental Assistance, HUD Direct Loans (Section 202 or Section 811), and HUD insurance.1 In addition, there are approximately 6,200 housing choice vouchers available.2 Including subsidized housing and those that accept housing choice vouchers provides a substantial target market and focuses limited resources for multifamily energy efficiency benefits to low and moderate income consumers. By working with the Housing Authority, the Housing Finance Corporation and other affordable housing administration offices Austin Energy can closely coordinate its energy efficiency programs with affordable housing renovation schedules and reach out to private properties that accept housing choice vouchers. 1 Taking Action: Preservation of Affordable Housing in the City of Austin, July 2014, Prepared by: HousingWorks Austin, Prepared for: Austin Housing Finance Corporation, City of Austin p. 8. 2 Ibid.
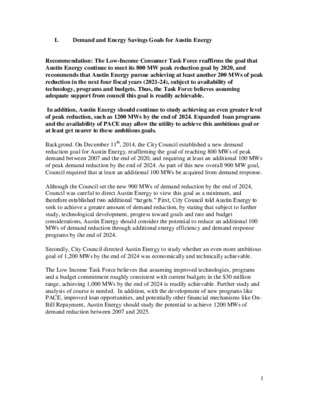
1 I. Demand and Energy Savings Goals for Austin Energy Recommendation: The Low-Income Consumer Task Force reaffirms the goal that Austin Energy continue to meet its 800 MW peak reduction goal by 2020, and recommends that Austin Energy pursue achieving at least another 200 MWs of peak reduction in the next four fiscal years (2021-24), subject to availability of technology, programs and budgets. Thus, the Task Force believes assuming adequate support from council this goal is readily achievable. In addition, Austin Energy should continue to study achieving an even greater level of peak reduction, such as 1200 MWs by the end of 2024. Expanded loan programs and the availability of PACE may allow the utility to achieve this ambitious goal or at least get nearer to these ambitious goals. Backgrond. On December 11th, 2014, the City Council established a new demand reduction goal for Austin Energy, reaffirming the goal of reaching 800 MWs of peak demand between 2007 and the end of 2020, and requiring at least an additional 100 MWs of peak demand reduction by the end of 2024. As part of this new overall 900 MW goal, Council required that at least an additional 100 MWs be acquired from demand response. Although the Council set the new 900 MWs of demand reduction by the end of 2024, Council was careful to direct Austin Energy to view this goal as a minimum, and therefore established two additional “targets.” First, City Council told Austin Energy to seek to achieve a greater amount of demand reduction, by stating that subject to further study, technological development, progress toward goals and rate and budget considerations, Austin Energy should consider the potential to reduce an additional 100 MWs of demand reduction through additional energy efficiency and demand response programs by the end of 2024. Secondly, City Council directed Austin Energy to study whether an even more ambitious goal of 1,200 MWs by the end of 2024 was economically and technically achievable. The Low Income Task Force believes that assuming improved technologies, programs and a budget commitment roughly consistent with current budgets in the $30 million range, achieving 1,000 MWs by the end of 2024 is readily achievable. Further study and analysis of course is needed. In addition, with the development of new programs like PACE, improved loan opportunities, and potentially other financial mechanisms like On-Bill Repayment, Austin Energy should study the potential to achieve …
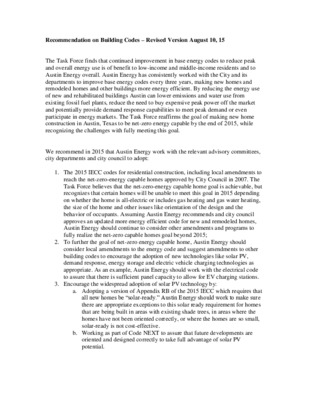
Recommendation on Building Codes – Revised Version August 10, 15 The Task Force finds that continued improvement in base energy codes to reduce peak and overall energy use is of benefit to low-income and middle-income residents and to Austin Energy overall. Austin Energy has consistently worked with the City and its departments to improve base energy codes every three years, making new homes and remodeled homes and other buildings more energy efficient. By reducing the energy use of new and rehabilitated buildings Austin can lower emissions and water use from existing fossil fuel plants, reduce the need to buy expensive peak power off the market and potentially provide demand response capabilities to meet peak demand or even participate in energy markets. The Task Force reaffirms the goal of making new home construction in Austin, Texas to be net-zero energy capable by the end of 2015, while recognizing the challenges with fully meeting this goal. We recommend in 2015 that Austin Energy work with the relevant advisory committees, city departments and city council to adopt: 1. The 2015 IECC codes for residential construction, including local amendments to reach the net-zero-energy capable homes approved by City Council in 2007. The Task Force believes that the net-zero-energy capable home goal is achievable, but recognizes that certain homes will be unable to meet this goal in 2015 depending on whether the home is all-electric or includes gas heating and gas water heating, the size of the home and other issues like orientation of the design and the behavior of occupants. Assuming Austin Energy recommends and city council approves an updated more energy efficient code for new and remodeled homes, Austin Energy should continue to consider other amendments and programs to fully realize the net-zero capable homes goal beyond 2015; 2. To further the goal of net-zero energy capable home, Austin Energy should consider local amendments to the energy code and suggest amendments to other building codes to encourage the adoption of new technologies like solar PV, demand response, energy storage and electric vehicle charging technologies as appropriate. As an example, Austin Energy should work with the electrical code to assure that there is sufficient panel capacity to allow for EV charging stations. 3. Encourage the widespread adoption of solar PV technology by: a. Adopting a version of Appendix RB of the 2015 IECC which requires that all new homes be “solar-ready.” Austin Energy should …
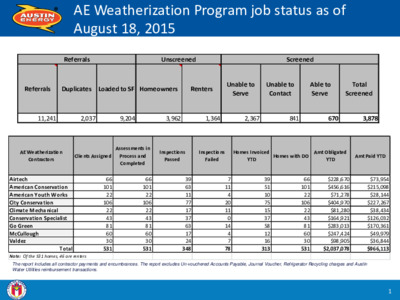
AE Weatherization Program job status as of August 18, 2015 1 ReferralsDuplicates Loaded to SFHomeownersRentersUnable to ServeUnable to Contact Able to ServeTotal Screened11,2412,0379,2043,9621,3642,3678416703,878ReferralsUnscreenedScreenedAE Weatherization ContractorsClients AssignedAssessments in Process and CompletedInspections PassedInspections FailedHomes Invoiced YTDHomes with DOAmt Obligated YTDAmt Paid YTDAirtech66663973966$228,670$73,954American Conservation101101631151101$456,616$215,098American Youth Works22221141022$71,278$28,144City Conservation 106106772075106$404,970$227,267Climate Mechanical222217111522$81,280$38,434Conservation Specialist43433703743$164,921$126,032Go Green818163145881$283,013$170,361McCullough60601741260$247,424$49,979Valdez30302471630$98,905$36,844Total53153134878313531$2,037,078$966,113Note: Of the 531 homes, 46 are rentersThe report includes all contractor payments and encumbrances. The report excludes Un-vouchered Accounts Payable, Journal Voucher, Refrigerator Recycling charges and Austin Water Utilities reimbursement transactions.
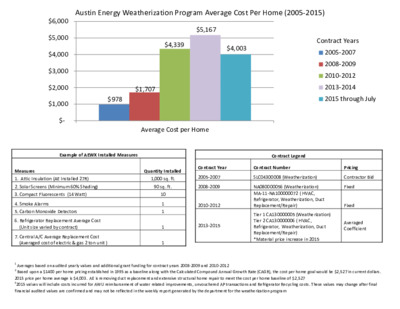
Austin Energy Weatherization Program Average Cost Per Home (2005-2015) 1 Averages based on audited yearly values and additional grant funding for contract years 2008-2009 and 2010-2012 2 Based upon a $1400 per home pricing established in 1995 as a baseline along with the Calculated Compound Annual Growth Rate (CAGR), the cost per home goal would be $2,527 in current dollars. 2015 price per home average is $4,003. AE is removing duct replacement and extensive structural home repair to meet the cost per home baseline of $2,527 32015 values will include costs incurred for AWU reimbursement of water related improvements, unvouchered AP transactions and Refrigerator Recycling costs. These values may change after final financial audited values are confirmed and may not be reflected in the weekly report generated by the department for the weatherization program $978 $1,707 $4,339 $5,167 $4,003 $- $1,000 $2,000 $3,000 $4,000 $5,000 $6,000Average Cost per Home2005-20072008-20092010-20122013-20142015 through JulyExample of AEWX Installed Measures Measures Quantity Installed 1. Attic Insulation (AE Installed 27R) 1,000 sq. ft. 2. Solar Screens (Minimum 60% Shading) 90 sq. ft. 3. Compact Fluorescents (14 Watt) 10 4. Smoke Alarms 1 5. Carbon Monoxide Detectors 1 6. Refrigerator Replacement Average Cost (Unit size varied by contract) 1 7. Central A/C Average Replacement Cost (Averaged cost of electric & gas 2 ton unit ) 1 Contract Legend Contract Year Contract Number Pricing 2005-2007 SLC04300008 (Weatherization) Contractor Bid 2008-2009 NA080000056 (Weatherization) Fixed 2010-2012 MA-11-NA100000072 ( HVAC, Refrigerator, Weatherization, Duct Replacement/Repair) Fixed 2013-2015 Tier 1 CA130000005 (Weatherization) Tier 2 CA130000006 ( HVAC, Refrigerator, Weatherization, Duct Replacement/Repair) *Material price increase in 2015 Averaged Coefficient Contract Years
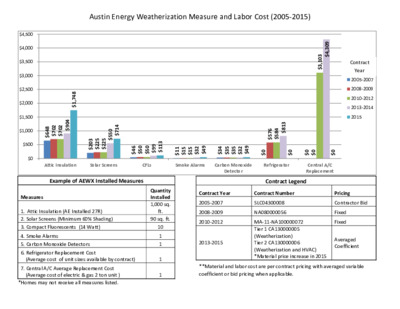
Austin Energy Weatherization Measure and Labor Cost (2005-2015) *Homes may not receive all measures listed. $648 $203 $46 $11 $34 $0 $0 $702 $225 $50 $15 $35 $576 $0 $702 $225 $50 $15 $35 $584 $3,103 $904 $550 $99 $32 $32 $813 $4,309 $1,748 $714 $113 $49 $49 $0 $0 $0$500$1,000$1,500$2,000$2,500$3,000$3,500$4,000$4,500Attic InsulationSolar ScreensCFLsSmoke AlarmsCarbon MonoxideDetectorRefrigeratorCentral A/CReplacement2005-20072008-20092010-20122013-20142015Contract Legend Contract Year Contract Number Pricing 2005-2007 SLC04300008 Contractor Bid 2008-2009 NA080000056 Fixed 2010-2012 MA-11-NA100000072 Fixed 2013-2015 Tier 1 CA130000005 (Weatherization) Tier 2 CA130000006 (Weatherization and HVAC) *Material price increase in 2015 Averaged Coefficient Example of AEWX Installed Measures Measures Quantity Installed 1. Attic Insulation (AE Installed 27R) 1,000 sq. ft. 2. Solar Screens (Minimum 60% Shading) 90 sq. ft. 3. Compact Fluorescents (14 Watt) 10 4. Smoke Alarms 1 5. Carbon Monoxide Detectors 1 6. Refrigerator Replacement Cost (Average cost of unit sizes available by contract) 1 7. Central A/C Average Replacement Cost (Average cost of electric & gas 2 ton unit ) 1 Contract Year **Material and labor cost are per contract pricing with averaged variable coefficient or bid pricing when applicable.
MEMORANDUM TO: Low Income Consumer Advisory Task Force (LICATF) FROM: Denise Kuehn, Energy Efficiency Services Director DATE: August 7, 2015 SUBJECT: Response to Low Income Consumer Advisory Task Force (LICATF) posting. Cooper Request Concerning AE Response to Background Portion of the LICATF Final Report In a follow up to the July 17 meeting, Lanetta Cooper provided the Background portion of the final report: 1. AE has provided FY14 audited financial information and the associated data associated with the Weatherization program. 2. For this draft, Lanetta has requested the FY 2014 weatherization program data funded by the Customer Benefit Charge broken out by Energy Efficiency Services and Customer Assistance Program. For the report, AE will provide both. 3. See answer to #2. 4. All population data is based on Census data (http://www.census.gov/), using 2010 and 2013 data. Data is based on Travis county Ms. Cooper also asked for a review of the Background portion of the report. That is provided below. As part of the edits, an error was found in the section regarding the 301-400% of federal poverty guidelines. The table below is from the report reference in the Background section. It is provided for additional support. The edits are provided as support to Ms. Cooper’s request and should not be viewed as the final edits or comments made by AE. Table 1a: Household Income and Electricity Burden Measures by Area (2010-2012) Measure Austin Brownsville Corpus Christi Dallas El Paso Houston San Antonio Texas Total Households 421,129 118,446 152,670 2,047,328 256,149 1,783,863 602,599 8,852,444 Households Below Poverty 55,841 36,627 24,678 257,433 57,514 248,758 93,035 1,333,625 % of all Households 13% 31% 16% 13% 22% 14% 15% 15% Households by Percent of Poverty Num (000s) Pct of Total Num (000s) Pct of Total Num (000s) Pct of Total Num (000s) Pct of Total Num (000s) Pct of Total Num (000s) Pct of Total Num (000s) Pct of Total Num (000s) Pct of Total 0-100% 55.8 13.3% 36.6 30.9% 24.7 16.2% 257.4 12.6% 57.5 22.4% 248.8 13.9% 93 15.4% 1333.6 15.1% 101-200% 62.4 14.8% 31.4 26.5% 33.9 22.2% 367.4 17.9% 66.8 26.1% 324.1 18.2% 121.3 20.1% 1744.1 19.7% 201-300% 64.0 15.2% 18.2 15.4% 27.0 17.7% 318.6 15.6% 43.6 17.0% 272.8 15.3% 109.1 18.1% 1453.7 16.4% 301-400% 53.9 12.8% 11.8 10.0% 19.7 12.9% 268.5 13.1% 29.3 11.4% 221 12.4% 77.8 12.9% 1142.4 12.9% 401+% 184.9 43.9% 20.4 17.2% 47.4 31.0% 835.3 40.8% 58.9 …
TO: Low Income Consumer Advisory Task Force (LICATF) FROM: Denise Kuehn, Energy Efficiency Services Director DATE: August 14, 2015 SUBJECT: Questions Concerning Questions Submitted by Lanetta Cooper in July 17, 2015 Low Income Consumer Advisory Task Force 1. The 2012 GDS report provided the Task Force stated at p. 2 that AE uses “Salesforce.com” to store data. a. Please explain how AE uses “Salesforce.com” including an explanation of what data is stored and how it is stored. Answer: Salesforce.com is a customer relationship management tool. It allows data to be accessed by certified and verified users as needed for their roles. Data is stored via a secure cloud service monitored in real time by Symantec and verified by TRUSTe. These storage protocols meet or exceed City protocols. Access is available to only those with authorized user names and passwords who have completed Salesforce training. b. How does, if at all, AE track pre and post weatherization installations consumption involving its customers (include energy performance star) Answer: Consumption analysis is based on one of two methods: billing data or daily data. The option of which data source is used is dependent on data availability and the transitory nature of the customers. c. Has AE formatted its billing histories so that it can pull up by energy efficiency program pre and post EE program installations consumptions? If not, why not and what would AE need to do to be able to create a data base that could be accessible by EE program. (I am assuming the use of billing data aggregated by EE program and not individual customer data). Answer: AE is currently developing a data warehouse and related data structures to meet reporting needs. Data for energy efficiency analysis will reside in this data warehouse for ease of reporting. The data warehouse is in its initial stages of development. The goal is that all program data will be housed and available for analysis in this centralized location by FY2017. Reports will also be available using the new Direct Technology rebate processing tool in which the before and after usage of the customer receiving the rebate will be available allowing AE to verify the cost benefit effectively. The Direct Technology tool will process and track the energy, demand reduction savings and rebates for sixteen Customer Energy Solutions programs scheduled to be implemented fall 2015. 2. Please verify that the attached documents were …
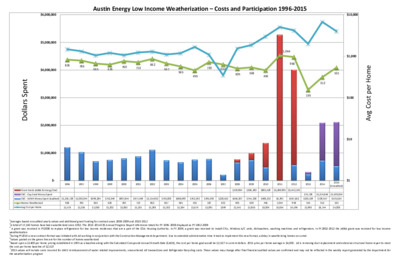
Austin Energy Low Income Weatherization – Costs and Participation 1996-2015 1Averages based on audited yearly values and additional grant funding for contract years 2008-2009 and 2010-2012 2A total of 17,160 homes have been weatherized since 1982. The 2013-2014 CES Annual Progress Report references totals for FY 1996-2008 displayed as FY 1982-2008 3 A grant was received in FY2008 to replace refrigerators for low income residences that are a part of the COA Housing Authority. In FY 2009, a grant was received to install CFLs, Window A/C units, dishwashers, washing machines and refrigerators. In FY2002-2012 the ARRA grant was received for low income weatherization 4During FY2013 a new contract format was initiated with AE working in conjunction with the Construction Management department. Due to extended administrative time it took to implement this new format, a delay in weatherizing homes occurred. 5Values posted on the green line are for the number of homes weatherized 6Based upon a $1400 per home pricing established in 1995 as a baseline along with the Calculated Compound Annual Growth Rate (CAGR), the cost per home goal would be $2,527 in current dollars. 2015 price per home average is $4,003. AE is removing duct replacement and extensive structural home repair to meet the cost per home baseline of $2,527 72015 values will include costs incurred for AWU reimbursement of water related improvements, unvouchered AP transactions and Refrigerator Recycling costs. These values may change after final financial audited values are confirmed and may not be reflected in the weekly report generated by the department for the weatherization program 19961997199819992000200120022003200420052006200720082009201020112012201320142015(Unaudited)Grant Funds (ARRA & Energy Star)$119,984$258,283$881,529$5,269,995$3,452,135CBC - Cap Fund Money Spent$75,728$1,374,646$1,593,854CBC - AEWX Money Spent (Audited)$1,216,728$1,033,044$698,284$752,359$807,844$877,559$1,114,932$735,003$668,690$762,192$785,392$220,532$658,207$744,238$488,213$6,291$567,662$233,139$729,547$531,634Homes Weatherized8267856656267607138626675654557206325055384561,044958155312531Avg Cost per Home$1,473$1,316$1,050$1,202$1,063$1,231$1,293$1,102$1,184$1,675$1,091$349$1,541$1,863$3,004$5,054$4,196$1,993$6,744$4,003 826 785 665 626 760 713 862 667 565 455 720 632 505 538 456 1,044 958 155 312 531 $1$10$100$1,000$10,000 $- $1,000,000 $2,000,000 $3,000,000 $4,000,000 $5,000,000 $6,000,000Avg Cost per Home Dollars Spent
MEMORANDUM TO: Low Income Consumer Advisory Task Force (LICATF) FROM: Denise Kuehn, Energy Efficiency Services Director DATE: August 14, 2015 SUBJECT: Response to Low Income Consumer Advisory Task Force (LICTF) Question Regarding Number of AEP Rebates paid to Multifamily Units in FY14 Question: “How many AEP central system rebates are going to multifamily properties?” Answer: A review of the FY14 data indicated that 19 AEP rebates went to multifamily properties. or roughly 0.3% of AEP rebates.
1 TO: Low Income Advisory Task Force FROM: Denise Kuehn, Energy Efficiency Services Director DATE: August 14, 2015 SUBJECT: Questions Concerning the Changes of Costs Associated with AE Weatherization Program Over the past thirty years, Austin Energy has weatherized over 17,000 homes for low income customers. Cost of providing the weatherization program has changed due to two main contributing factors: the changes in the qualification criteria associated with resources available and the need of the community defining the type and costs of the measures provided. The qualification criteria of customers receiving low income weatherization has changed over the years based on federal and local influences. The federal government subsidizes many low income programs in conjunction with the City of Austin. This criterion has been based on the federal poverty rate which has varied from 100% to the current 200% and below in order to qualify. Additional criteria have been established for ensuring potential customers have not participated in the program over the past ten years. AE further qualifies based on the value and square footage of the home. In addition, AE partners with other city departments, utilities and non-profit organizations to reduce the costs in order to align resources. AE’s partnerships to address low income needs in the Austin area range from referrals and process enhancements to implementing home improvements for other entities. AE exchanges referrals with several entities such as Austin Water Utilities, Neighborhood Housing and Community Development (NHCD), Travis County, Housing Repair Coalition (collaboration of numerous non-profit and city organizations) and various other non-profit organizations. Over the past year, AE has worked with AWU, NHCD, Purchasing, Health and Human Services and non-profit agencies to develop a standard intake form and enhance communication. In addition to referrals, AE provides administrative support for AWU-provided water savings devices at no charge to AWU. AE provides energy saving weatherization while Neighborhood Housing provides structural repairs when federal grants are available. NHCD combines different grants to provide services such as lead removal and roof repairs to an average of 200-250 unique homes per year. NHCD receives a 10% administration fee to coordinate the in work for Austin Water on these homes. AWU provides the water saving devices and pays for the installation to NHCD. Weatherization is one of the many services the City of Austin provides low income customers. Basic services such as insulation and air infiltration are utility industry standard. As more …
1 MEMORANDUM TO: Low Income Consumer Advisory Task Force FROM: Liz Jambor, Customer Energy Solutions DATE: August 21, 2015 SUBJECT: Response to Lanetta Cooper’s Questions for August 7 Meeting During the August 7 Low Income Advisory Task Force (LICATF) meeting, Lanetta Cooper submitted questions for AE staff response. The questions and related responses follow. Please note that when mapping program data, premise addresses are used. Should a mailing address be captured that is outside of the AE service territory, it is not mapped. The majority of the responses are related to data provided to the Austin American Statesman in terms of program reach by zip code. Zip code data cannot be read in isolation because there are other factors to consider such as the overall population of the zip code, housing stock, and the percent of poverty per zip code. Statistically, many of the zip codes for population, percent poverty and rebates are within the norm. It is not a universality that “wealthier residents” get more in rebates than other customers. Additional factors, such as dwelling type, age of home and home ownership, play into the eventual participation in rebate programs. For example, a zip code dense with multifamily properties may “map” into a lower participation rate because the property with multiple apartment units is counted as one rebate (for a commercial customer) when the one rebate has actually served hundreds of residential customers. Overall, the programs are meeting the needs of our customers based on their ability and need to participate. 2 3 4 Reponses 1. The time periods varied by program but covered from program inception through 2014. Data was based on residential programs only. Please note that data provided on map may not be complete program data but only data that could be mapped accurately. 2. The map captured unaudited rebate data from program inceptions through 2014 and totaled $181,189,101. Please note that data provided on the map may not be complete program data but only data that could be mapped accurately and where financial records exist (for example, for the period 1982 – 1995, there is not separate accounting for low income weatherization, or other programs). 3. No non multifamily commercial rebates were included. 4. NA 5. See table of unaudited data below. Please note that data provided on the map may not be complete program data but only data that could be mapped accurately and …
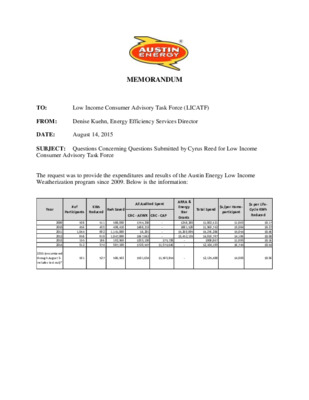
MEMORANDUM TO: Low Income Consumer Advisory Task Force (LICATF) FROM: Denise Kuehn, Energy Efficiency Services Director DATE: August 14, 2015 SUBJECT: Questions Concerning Questions Submitted by Cyrus Reed for Low Income Consumer Advisory Task Force The request was to provide the expenditures and results of the Austin Energy Low Income Weatherization program since 2009. Below is the information: CBC - AEWXCBC - CAP2009 538 511 588,030 $744,238 -$258,283$1,002,521$1,863$0.172010 456 433 498,410 $488,213 -$881,529$1,369,742$3,004$0.272011 1,044 992 1,141,090 $6,291 -$5,269,995$5,276,286$5,054$0.462012 958 910 1,047,090 $567,662 -$3,452,135$4,019,797$4,196$0.382013 155 186 192,360 $233,139$75,728 - $308,867$1,993$0.162014 312 374 387,190 $729,547$1,374,646 - $2,104,193$6,744$0.542015 (encumbered through August 3-includes test out)* 531 527 586,592 $531,634$1,593,854 -$2,125,488$4,003$0.36Total Spend$s/per Home-participant$s per Life-Cycle KWh ReducedAE Audited SpentYear# of ParticipantsKWs ReducedKwh Saved ARRA & Energy Star Grants
1 MEMORANDUM TO: Low Income Consumer Advisory Task Force FROM: Liz Jambor, Customer Energy Solutions DATE: August 21, 2015 SUBJECT: Response to Request by Lanetta Cooper to Extend Previous Data Set Lanetta Cooper requested an extension to a data set provided earlier in the LICATF process. This data set included the before and after kWh usage and payment status of customers in the weatherization program. The original data set contained 32 customers. Table 1 provides the original data set. The updated data, found in Table 2, set contains 9 customers. These are the customers that have consistently resided at the weatherized dwelling across the time line from October 2013 through July 2015. There is not consistent savings, post install, across all customers or across all months. It appears that there may be some behavioral impacts to energy savings post-weatherization. 2 Table 1. Original Data Set, Pre and Post kWh Usage StatusInstall DateActual Job CostOct-13Nov-13Dec-13Jan-14Feb-14Mar-14Apr-14May-14Jun-14Jul-14Aug-14Sep-14Current12/5/13$5,939.65927.00 625.00 Install853.00 803.00 829.00 723.00 784.00 1,025.00 1,172.00 1,284.00 1,350.00 Current12/19/13$6,237.27740.00 432.00 Install934.00 706.00 669.00 505.00 520.00 656.00 776.00 737.00 805.00 Current1/14/14$5,998.901,060.00 1,018.00 914.00 Install840.00 860.00 1,180.00 1,046.00 820.00 1,228.00 1,086.00 1,446.00 Current2/20/14$7,050.72960.00 552.00 758.00 864.00 Install544.00 524.00 690.00 836.00 1,208.00 1,184.00 1,270.00 Delinquent3/4/14$5,700.991,810.00 312.00 596.00 744.00 744.00 Install426.00 538.00 1,024.00 1,614.00 1,796.00 2,130.00 Current3/5/14$6,910.172,416.00 1,300.00 1,948.00 2,546.00 2,232.00 Install844.00 1,198.00 1,616.00 2,450.00 2,498.00 2,534.00 Delinquent3/7/14$9,195.884,670.00 3,154.00 3,868.00 4,596.00 3,810.00 Install2,372.00 2,840.00 3,408.00 4,524.00 4,972.00 5,100.00 Current3/14/14$7,945.061,350.00 756.00 634.00 674.00 600.00 Install589.00 826.00 925.00 1,241.00 1,276.00 1,303.00 Delinquent3/26/14$6,970.931,162.00 754.00 797.00 878.00 685.00 Install534.00 836.00 1,025.00 1,339.00 1,525.00 1,597.00 Current3/27/14$5,933.89749.00 410.00 401.00 388.00 345.00 Install365.00 444.00 797.00 855.00 956.00 970.00 Delinquent4/2/14$9,735.133,852.00 2,152.00 2,404.00 2,624.00 2,022.00 1,566.00 Install2,150.00 2,802.00 3,548.00 3,754.00 4,022.00 Current4/4/14$7,000.561,744.00 1,218.00 1,030.00 1,290.00 1,110.00 1,010.00 Install1,412.00 1,774.00 2,098.00 2,104.00 2,146.00 Current4/11/14$9,831.912,104.00 2,390.00 2,643.00 3,269.00 2,488.00 2,022.00 Install1,333.00 2,031.00 2,402.00 2,279.00 2,219.00 Delinquent4/16/14$11,920.871,465.00 1,185.00 2,297.00 2,584.00 2,076.00 1,743.00 Install1,478.00 1,884.00 2,349.00 2,221.00 1,533.00 Current4/17/14$8,843.714,226.00 2,602.00 3,058.00 1,874.00 1,972.00 1,406.00 Install2,594.00 3,430.00 3,736.00 3,894.00 3,832.00 Current4/17/14$5,580.693,024.00 2,286.00 1,726.00 1,120.00 1,372.00 1,668.00 Install2,480.00 2,878.00 4,084.00 3,942.00 4,114.00 Delinquent5/1/14$5,406.834,914.00 3,622.00 2,706.00 3,050.00 2,672.00 2,494.00 3,100.00 Install4,632.00 4,268.00 5,120.00 4,854.00 Current5/1/14$5,094.823,302.00 2,808.00 3,446.00 3,344.00 3,398.00 2,854.00 2,612.00 Install3,296.00 3,612.00 3,466.00 3,962.00 Current5/2/14$6,474.623,372.00 2,078.00 2,370.00 3,374.00 2,580.00 1,906.00 1,330.00 Install2,410.00 3,062.00 3,148.00 3,480.00 Current5/7/14$7,517.552,574.00 1,662.00 1,537.00 1,797.00 1,534.00 1,280.00 1,279.00 Install1,648.00 2,150.00 2,498.00 2,754.00 Delinquent5/8/14$7,161.654,480.00 3,034.00 2,996.00 3,398.00 2,758.00 2,700.00 3,078.00 Install4,814.00 6,050.00 6,266.00 5,152.00 Current5/14/14$7,643.023,182.00 2,228.00 3,628.00 3,970.00 2,634.00 1,830.00 1,562.00 Install3,050.00 2,084.00 1,892.00 2,462.00 Current5/15/14$8,574.25948.00 928.00 1,136.00 988.00 888.00 …

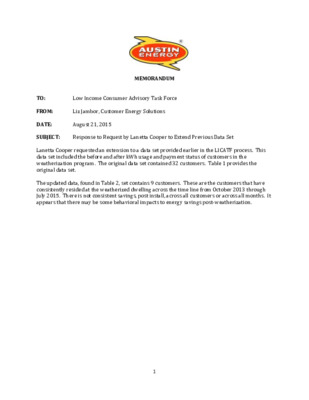
4Number of units1Electricity Rate ($/kWh)$0.109Initial Cost per Unit (estimated retail price)$180$140Energy Efficiency Ratio (EER)11.28.0Cooling Capacity of Air Conditioner (Btu/hr)5,0005,000Annual Operating Costs*Energy cost$117$164$47Energy consumption (kWh)1,0771,508431Maintenance cost$0$0$0Total$117$164$47Life Cycle Costs*Operating costs (energy and maintenance)$872$1,221$349Energy costs$872$1,221$349Energy consumption (kWh)9,69113,5683,876Maintenance costs$0$0$0Purchase price for 1 unit(s)$180$140-$40Total$1,052$1,361$309Simple payback of initial additional cost (years)† 0.9 Initial cost difference$40Life cycle savings $349Net life cycle savings (life cycle savings - additional cost)$309Simple payback of additional cost (years)0.9Life cycle energy saved (kWh)3,876Life cycle air pollution reduction (lbs of CO2)5,970Air pollution reduction equivalence (number of cars removed from the road for a year)1Air pollution reduction equivalence (acres of forest) 1Savings as a percent of retail price172%ENERGY STAR Qualified UnitConventional UnitLife Cycle Cost Estimate for1 ENERGY STAR Qualified Room Air Conditioner(s)This energy savings calculator was developed by the U.S. EPA and U.S. DOE and is provided for estimating purposes only. Actual energy savings may vary based on use and other factors.Enter your own values in the gray boxes or use our default values.Annual and Life Cycle Costs and Savings for 1 Room Air Conditioner(s)† A simple payback period of zero years means that the payback is immediate.Summary of Benefits for 1 Room Air Conditioner(s)1 ENERGY STAR Qualified Unit(s)1 Conventional Unit(s) Savings with ENERGY STAR* Annual costs exclude the initial purchase price. All costs, except initial cost, are discounted over the products' lifetime using a real discount rate of 4%. See "Assumptions" to change factors including the discount rate.Choose your city from the menu at right
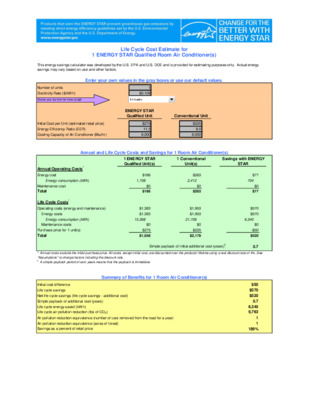
4Number of units1Electricity Rate ($/kWh)$0.109Initial Cost per Unit (estimated retail price)$275$225Energy Efficiency Ratio (EER)11.38.0Cooling Capacity of Air Conditioner (Btu/hr)8,0008,000Annual Operating Costs*Energy cost$186$263$77Energy consumption (kWh)1,7082,412704Maintenance cost$0$0$0Total$186$263$77Life Cycle Costs*Operating costs (energy and maintenance)$1,383$1,953$570Energy costs$1,383$1,953$570Energy consumption (kWh)15,36821,7086,340Maintenance costs$0$0$0Purchase price for 1 unit(s)$275$225-$50Total$1,658$2,178$520Simple payback of initial additional cost (years)† 0.7 Initial cost difference$50Life cycle savings $570Net life cycle savings (life cycle savings - additional cost)$520Simple payback of additional cost (years)0.7Life cycle energy saved (kWh)6,340Life cycle air pollution reduction (lbs of CO2)9,763Air pollution reduction equivalence (number of cars removed from the road for a year)1Air pollution reduction equivalence (acres of forest) 1Savings as a percent of retail price189%ENERGY STAR Qualified UnitConventional UnitLife Cycle Cost Estimate for1 ENERGY STAR Qualified Room Air Conditioner(s)This energy savings calculator was developed by the U.S. EPA and U.S. DOE and is provided for estimating purposes only. Actual energy savings may vary based on use and other factors.Enter your own values in the gray boxes or use our default values.Annual and Life Cycle Costs and Savings for 1 Room Air Conditioner(s)† A simple payback period of zero years means that the payback is immediate.Summary of Benefits for 1 Room Air Conditioner(s)1 ENERGY STAR Qualified Unit(s)1 Conventional Unit(s) Savings with ENERGY STAR* Annual costs exclude the initial purchase price. All costs, except initial cost, are discounted over the products' lifetime using a real discount rate of 4%. See "Assumptions" to change factors including the discount rate.Choose your city from the menu at right
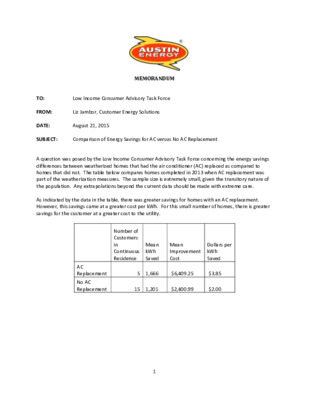
1 MEMORANDUM TO: Low Income Consumer Advisory Task Force FROM: Liz Jambor, Customer Energy Solutions DATE: August 21, 2015 SUBJECT: Comparison of Energy Savings for AC versus No AC Replacement A question was posed by the Low Income Consumer Advisory Task Force concerning the energy savings differences between weatherized homes that had the air conditioner (AC) replaced as compared to homes that did not. The table below compares homes completed in 2013 when AC replacement was part of the weatherization measures. The sample size is extremely small, given the transitory nature of the population. Any extrapolations beyond the current data should be made with extreme care. As indicated by the data in the table, there was greater savings for homes with an AC replacement. However, this savings came at a greater cost per kWh. For this small number of homes, there is greater savings for the customer at a greater cost to the utility. Number of Customers in Continuous Residence Mean kWh Saved Mean Improvement Cost Dollars per kWh Saved AC Replacement 5 1,666 $6,409.25 $3.85 No AC Replacement 15 1,201 $2,400.99 $2.00
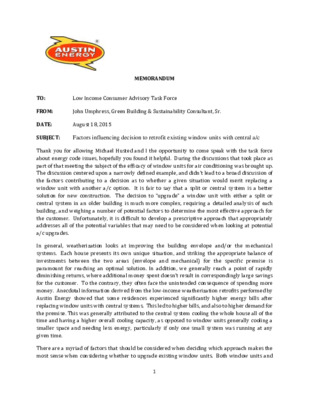
1 MEMORANDUM TO: Low Income Consumer Advisory Task Force FROM: John Umphress, Green Building & Sustainability Consultant, Sr. DATE: August 18, 2015 SUBJECT: Factors influencing decision to retrofit existing window units with central a/c Thank you for allowing Michael Husted and I the opportunity to come speak with the task force about energy code issues, hopefully you found it helpful. During the discussions that took place as part of that meeting the subject of the efficacy of window units for air conditioning was brought up. The discussion centered upon a narrowly defined example, and didn’t lead to a broad discussion of the factors contributing to a decision as to whether a given situation would merit replacing a window unit with another a/c option. It is fair to say that a split or central system is a better solution for new construction. The decision to “upgrade” a window unit with either a split or central system in an older building is much more complex, requiring a detailed analysis of each building, and weighing a number of potential factors to determine the most effective approach for the customer. Unfortunately, it is difficult to develop a prescriptive approach that appropriately addresses all of the potential variables that may need to be considered when looking at potential a/c upgrades. In general, weatherization looks at improving the building envelope and/or the mechanical systems. Each house presents its own unique situation, and striking the appropriate balance of investments between the two areas (envelope and mechanical) for the specific premise is paramount for reaching an optimal solution. In addition, we generally reach a point of rapidly diminishing returns, where additional money spent doesn’t result in correspondingly large savings for the customer. To the contrary, they often face the unintended consequence of spending more money. Anecdotal information derived from the low-income weatherization retrofits performed by Austin Energy showed that some residences experienced significantly higher energy bills after replacing window units with central systems. This led to higher bills, and also to higher demand for the premise. This was generally attributed to the central system cooling the whole house all of the time and having a higher overall cooling capacity, as opposed to window units generally cooling a smaller space and needing less energy, particularly if only one small system was running at any given time. There are a myriad of factors that should be considered when deciding which …
Backup