B-03 Educational Impact Statement.pdf — original pdf
Backup

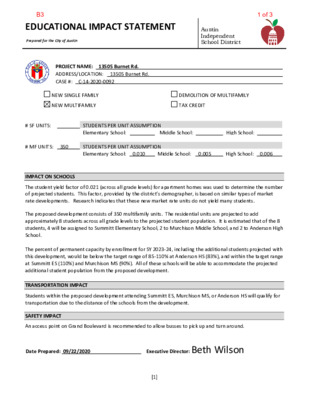
EDUCATIONAL IMPACT S TATEMENT Prepared for the City of Austin Austin Independent School District 13505 PRO JECT NAME: ADDRESS/LOCATION: CASE #: C - 14 - 2020 - 0092 Burnet Rd. 13505 Burnet Rd. NEW SINGLE FAMILY NEW MULTIFAMILY DEMOLITION OF MULTIFAMILY TAX CREDIT # SF UNITS: STUDENTS PER UNIT ASSUMPTION Elementary School: Middle School: High School: # MF UNITS: 350 STUDENTS PER UNIT ASSUMPTION Elementary School: 0.01 0 Middle School: 0.005 High School: 0.006 IMPACT ON SCHOOLS The student yield factor of 0.021 (across all grade levels) for apartment homes was used to determine the number of projected students. This factor, provided by the district’s demographer, is based on similar types of market rate developments. Research indicates that these new market rate units do not yield many students. The proposed development consists of 350 multifamily units. The residential units are projected to add approximately 8 students across all grade levels to the projected student population. It is estimated that of the 8 students, 4 will be assigned to Summitt Elementary School, 2 to Murchison Middle School, and 2 to Anderson High School. The percent of permanent capacity by enrollment for SY 2023-24, including the additional students projected with this development, would be below the target range of 85-110% at Anderson HS (83%), and within the target range at Summitt ES (110%) and Murchison MS (90%). All of these schools will be able to accommodate the projected additional student population from the proposed development. Students within the proposed development attending Summitt ES, Murchison MS, or Anderson HS will qualify for transportation due to the distance of the schools from the development. TRANSPORTATION IMPACT SAFETY IMPACT An access point on Grand Boulevard is recommended to allow busses to pick up and turn around. Date Prepared: 09/22/2020 Executive Director: Beth Wilson [1] B31 of 3 EDUCATIONAL IMPACT S TATEMENT Prepared for the City of Austin Austin Independent School District DATA ANALYSIS WORKSHEET ELEMENTARY SCHOOL: Summitt RATING: Met Standard ADDRESS: % QUALIFIED FOR FREE/REDUCED LUNCH: 12207 Brigadoon Ln. 34.73% PERMANENT CAPACITY: 731 MOBILITY RATE: +25.8% POPULATION (without mobility rate) ELEMENTARY SCHOOL STUDENTS 2019-20 Population 5- Year Projected Population (without proposed development) 5-Year Projected Population (with proposed development) ENROLLMENT (with mobility rate) ELEMENTARY SCHOOL STUDENTS 2019-20 Enrollment 5- Year Projected Enrollment (without proposed development) 5-Year Projected Enrollment (with proposed development) Number % of Permanent Capacity Number % of Permanent Capacity 674 92% 848 116% 1,386 108% MIDDLE SCHOOL: Murchison RATING: Met Standard ADDRESS: % QUALIFIED FOR FREE/REDUCED LUNCH: 3700 N. Hills Drive PERMANENT CAPACITY: 1,286 (2020-21 capacity) 21.27% MOBILITY RATE: -2.4% POPULATION (without mobility rate) MIDDLE SCHOOL STUDENTS Number % of Permanent Capacity 2019-20 Population 5- Year Projected Population (without proposed development) 5-Year Projected Population (with proposed development) 642 88% 807 110% 1,222 95% 638 87% 803 110% 1,220 95% [2] B32 of 3 EDUCATIONAL IMPACT S TATEMENT Prepared for the City of Austin Austin Independent School District ENROLLMENT (with mobility rate) MIDDLE SCHOOL STUDENTS Number % of Permanent Capacity 1,353 105% 1,161 90% 2019-20 Enrollment 5- Year Projected Enrollment (without proposed development) 5-Year Projected Enrollment (with proposed development) HIGH SCHOOL: Anderson RATING: Met Standard ADDRESS: % QUALIFIED FOR FREE/REDUCED LUNCH: 8403 Mesa Drive 21.75% PERMANENT CAPACITY: 2,478 MOBILITY RATE: +1.9% POPULATION (without mobility rate) 2019-20 Population 5- Year Projected Population (without proposed development) 5-Year Projected Population (with proposed development) ENROLLMENT (with mobility rate) 2019-20 Enrollment 5- Year Projected Enrollment (without proposed development) 5-Year Projected Enrollment (with proposed development) HIGH SCHOOL STUDENTS Number % of Permanent Capacity HIGH SCHOOL STUDENTS Number % of Permanent Capacity 2,175 88% 2,216 89% 1,163 90% 2,065 83% 2,069 83% 2,063 83% 2,067 83% [3] B33 of 3