Backup — original pdf
Backup
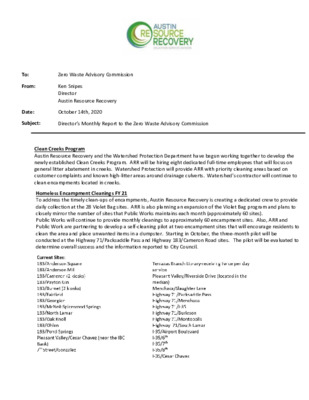
To: From: Zero Waste Advisory Commission Ken Snipes Director Austin Resource Recovery Date: October 14th, 2020 Subject: Director’s Monthly Report to the Zero Waste Advisory Commission Clean Creeks Program Austin Resource Recovery and the Watershed Protection Department have begun working together to develop the newly established Clean Creeks Program. ARR will be hiring eight dedicated full-time employees that will focus on general litter abatement in creeks. Watershed Protection will provide ARR with priority cleaning areas based on customer complaints and known high-litter areas around drainage culverts. Watershed’s contractor will continue to clean encampments located in creeks. Homeless Encampment Cleanings FY 21 To address the timely clean-ups of encampments, Austin Resource Recovery is creating a dedicated crew to provide daily collection at the 28 Violet Bag sites. ARR is also planning an expansion of the Violet Bag program and plans to closely mirror the number of sites that Public Works maintains each month (approximately 60 sites). Public Works will continue to provide monthly cleanings to approximately 60 encampment sites. Also, ARR and Public Work are partnering to develop a self-cleaning pilot at two encampment sites that will encourage residents to clean the area and place unwanted items in a dumpster. Starting in October, the three-month pilot will be conducted at the Highway 71/Packsaddle Pass and Highway 183/Cameron Road sites. The pilot will be evaluated to determine overall success and the information reported to City Council. Recycle and ReUse Drop-Off Center As the positive cases are declining and Austin-Travis County has moved to Stage 3 of COVID-19 risk-based guidelines, ARR has re-opened the Recycle and ReUse Drop-Off Center for appointment only services. RRDOC staff continued to perform home pick-up services of household hazardous waste for the customers already scheduled through September. The appointment drop-offs at the RRDOC began Tuesday, September 8th, and continued Monday through Friday throughout the month. The RRDOC appointment program expanded to include Saturdays starting October 3rd, 2020. The current 6 days per week schedule will continue until further changes in the COVID-19 guidelines. Customers will be required to wear a mask and will be asked to keep social distancing in mind while dropping off their items. Resumption of Brush and Bulk Collections Beginning the week of October 12th, brush collection routes will resume, and bulk collection will resume the week of October 26th. Customers will receive postcards in the mail informing them of their scheduled collection date. Back in March, Austin Resource Recovery decided to suspend bulk and brush collections to focus resources on essential weekly collection services. Resumption of Extra Trash Fees “Extra” trash fees was reinstated on September 7th, 2020. ARR waived fees effective March 27th through September 7th, 2020, in response to the COA Stay at Home Order and COVID-19. An estimate of Revenue foregone during this time was over $64,000(based on last year’s numbers). Fix-It At Home Series To continue to provide repair education while in-person Fix-It Clinics are suspended, the Circular Economy Program hosted Fix-It At Home!, a free on-line series of interactive workshops teaching basic repair skills taught by paid local instructors this summer. We hosted 20 classes on topics such as sewing repairs by hand, sewing machine basics, bicycle maintenance and guitar adjustments, including 2 Spanish-language classes. Nearly 300 people attended the series, and over 800 registered and received a link to view the recording. The series was well-received, with 90% of post-event survey respondents rating their overall satisfaction as an 8, 9 or 10. (on scale of 1-10). The program will make videos from the workshops available on-line for ongoing repair education. ARR Solicitations Update As of September 23, 2020 ZWAC Meeting October 14, 2020 Upcoming Solicitations Under Development (in alphabetical order): No Updates Solicitations Expected to be Posted Within the Next 90 Days: 1. Daily Drop-Off of Material Collected Through Dumpster or Roll-Off Service: IFB – Contractor to receive daily collections of bulk materials from the City at their disposal facility or landfill. No existing contract. 2. Education, Cleanup, and Beautification Services: RFP – Contractors qualified to provide education, cleanup, and beautification services that benefit the public by improving Austin’s environment and aesthetics through a variety of programs and providing resources and education that inspire Austin residents toward effective environmental stewardship. Link to current contract. 3. Post-Disaster Debris Removal Services: RFP – Contractor to provide emergency debris removal services in accordance with Federal Emergency Management Administration (FEMA) guidelines. No existing contract. 4. Post-Disaster Debris Monitoring Services: RFP – Contractor to provide emergency field debris monitoring services to include management and accounting services for monitoring the recovery efforts of the City’s Post Disaster Debris Removal Contractor. No existing contract. Published Solicitations: No Updates Solicitations in Evaluation or Negotiation: 1. Electronics Recycling: IFB 1500 SLW1045 – This solicitation was posted on August 24, 2020 and closed on September 17, 2020. Contractor to pick up, transport, and recycle computers, monitors, televisions, and other devices that operate using electrical parts in an environmentally sound manner. Link to current contract. 2. Recycling Processing for Non-Curbside Collections: IFB 1500 SLW1043 – This solicitation posted on June 15, 2020 and closed on July 28, 2020. Contractor to provide single-stream recyclable material processing and marketing services to sort, process, store, market, and sell single-stream recyclable material. The Contractor shall be responsible for picking up the recyclable material collected at the Recycle and Reuse Drop-off Center and receiving the recyclable material collected by ARR from City facilities. This is replacing two contracts: In-House Recycling and RRDOC Recycling. 3. Routine Non-Residential (City facilities) Dumpster Collection Services: IFB 7400 SLW1035 – This Solicitation posted March 9, 2020 and closed April 7, 2020. Contractor to collect trash, recycling, brush, bulk, and compostable Materials from City of Austin facilities. Scope may also include special event and emergency service needs at City facilities on an as-needed basis. RFI 1500 SLW6005 was issued in July 2019 related to these services. Link to current contract Definitions: CCO (Capital Contracting Office): Administers the procurement of professional and construction services. CO-OP (Cooperative Contract): A contract that has been competitively bid and issued by another government or purchasing alliance with the intention of sharing it with other governmental entities. IFB (Invitation for Bid): Formal bidding documents inviting suppliers to submit pricing for goods or services. RFI (Request for Information): Used to obtain industry input, feedback, or reactions from potential suppliers prior to issuing a solicitation. RFQ (Request for Quotation): Informal request to suppliers to provide quotes on specific goods or services. RFQS (Request for Qualifications): Formal solicitation used when qualifications are the main criteria for professional services. RFP (Request for Proposals): Formal request for a supplier to provide a solution and cost estimate to a complex need. Page 1 of 1 Austin Resource Recovery Curbside Collection and Drop Off Center Operations LAST FISCAL YEAR CURRENT FISCAL YEAR FY 2018 FY 2019 Jun 2019 Jul 2019 Jun 2020 Jul 2020 FY19 YTD (Oct 18-Jul 19) FY20 YTD (Oct 19-Jul 20) 128,829 10,231 528 130,307 11,040 517 10,490 1,329 42 11,623 1,541 46 109,980 8,880 424 12,426 12,680 113,489 758 22 5,306 287 Description of Services Tons of curbside Trash Tons of Curbside Bulk Disposed HHW Operations Tons Disposed Estimated Tons of Curbside Recycling Total Disposed Tons Collected Curbside and Residuals* 10,642 11,761 877 1,105 9,744 1,031 1,016 9,397 10,670 from Drop Off Center Operations 150,230 153,625 12,739 14,315 129,028 13,564 14,476 128,479 154,024 *Estimated tons of curbside recycling processed by vendors as residual - based on bi-annual sample route audit 4,773 4,671 Tons of curbside recycling RRC Tons Recycled/Reused RRC Tons of Brush Collected HHW Operations Tons recycled/reused Tons of Drop Off Center Collections Recycled/Reused Tons of Curbside Yard Trimmings Tons of Curbside Bulk Recycled Tons of Curbside Brush Collected Tons of Curbside Textiles Collected Tons of Carts Recycled Total Diverted Tons Collected Curbside and from Drop Off Center Operations Tons of Curbside Compost Collected** 48,005 1,986 1,505 469 3,759 32,244 201 6,292 150 154 90,805 14,414 47,528 2,259 2,595 477 5,073 37,265 257 6,447 77 166 96,813 22,040 3,789 182 218 43 411 2,711 32 717 5 0 7,665 1,670 3,955 231 181 41 404 2,406 49 660 0 16 7,489 1,520 40,448 1,894 2,218 398 4,283 33,774 227 5,187 77 132 84,128 19,567 **"Tons of Curbside Compost Collected" is included in the "Tons of Yard Trimmings Collected" Total Tons Collected Curbside and from Drop Off FY 2020 Goal 132,546 10,248 560 50,250 2,600 2,500 560 5,450 37,500 210 7,373 157 175 101,115 31,300 71 36 59 93 5 0 33 0 18 157 3,747 8,728 3,101 69 41 15 101 3,191 25 386 11 17 8,402 2,673 43,335 1,203 1,717 216 3,010 42,342 125 3,293 11 167 92,284 33,835 i d e s o p s D s n o T d e i t r e v D s n o T Center Operations 241,035 250,438 20,403 21,804 213,156 22,292 22,878 220,763 255,139 Estimated Percent of Curbside Collected Materials Diverted from Landfills by ARR 36.77% 37.47% 36.36% 33.18% 38.30% 38.78% 36.48% 41.05% 38.05% Pounds of Trash collected per customer per pickup 24.84 24.78 23.85 26.31 25.13 27.75 28.21 25.52 24.92 Number of Trash and Recycling Customers 199,448 202,292 203,017 203,881 201,956 206,680 207,473 205,281 204,549 customer per pickup (every other week) 18.62 18.17 17.33 18.00 18.59 21.44 20.90 19.60 18.99 Pounds of Recycled materials collected per Pounds of Yard Trimmings collected per customer per week 6.25 7.12 6.20 5.48 7.76 8.41 7.14 9.57 7.09 Number of Yard Trimmings/Organics Customers 198,325 201,174 201,861 202,773 200,850 205,527 206,329 204,127 203,508 Total tons of Dead Animals Collected from COA rights- of-way and the animal shelter 36 30 3 2 25 4 4 30 32 25,000 20,000 15,000 10,000 5,000 0 55% 50% 45% 40% 35% 30% 25% 45.00% 40.00% 35.00% 30.00% 25.00% Austin Resource Recovery Curbside Collection and Drop Off Center Operations 20,403 21,804 22,292 22,878 7,665 7,489 8,728 0 8,402 Jun 2019 Jul 2019 Jun 2020 Jul 2020 Total Diverted Tons Collected Curbside and from Drop Off Center Operations Total Tons Collected Curbside and from Drop Off Center Operations Estimated Percent of Curbside Collected Materials Diverted from Landfills by 0 0 ARR 36% 33% 38% 39% 36% 41% Jun 2019 Jul 2019 FY19 YTD (Oct 18-Jul 19) Jun 2020 Jul 2020 FY20 YTD (Oct 19-Jul 20) Reporting Status and Diversion Results for All Categories of Waste Generation Category of Waste Generation Residential Waste Diversion (city serviced accounts) Community Diversion Rate FY2015-16 FY2016-17 FY2017-18 FY2018-19 FY2019-20 FY2019-20 Actual 37.60% 42.02% Actual 37.51% * Actual 36.77% * Actual 37.47% * Goal 38.05% * Current 41.05% * *As prescribed in the Austin Resource Recovery Master Plan, the Department will conduct a detailed waste assessment study every five years to determine progress toward our Zero Waste goal. The first such study was published in 2015 and is titled Austin’s 2015 Community Diversion Study. The study focused on estimating diversion from both ARR-serviced properties and commercial properties. Commercial properties include retail businesses, food service establishments, professional offices, industrial properties, institutional facilities, government facilities, and multifamily properties five units and larger. According to Austin's 2015 Community Diversion Study, Residential Waste Diversion Rate (city serviced accounts) represents approximately 15% and the Community Diversion Rate (accounts serviced by private waste haulers) represents approximately 85% of the total citywide wastage. Residential Waste Diversion (city serviced accounts) 37.60% 37.51% 36.77% 37.47% 38.05% FY2015-16 Actual FY2016-17 Actual FY2017-18 Actual FY2018-19 Actual FY2019-20 Goal Category of Waste Generation Commercial Tons Landfilled** Commercial Tons Recycled** Commercial Organics Tons** CY 2016 CY 2017 1,152,661 360,244 206,165 1,708,484 722,573 97,173 ** Numbers reported here are compiled from self-reported data submitted by licensed private waste haulers via semi-annual tonnage reports required under Section 15-6-3 of the City Code on a calendar year basis and as such, ARR does not attest to the accuracy of these amounts. These numbers reflect data from 100-200 licensed haulers (number of haulers varies over time), and include haulers servicing dumpsters, roll-offs, construction and demolition debris, landscaping debris, and metal scrap. These numbers do not reflect all data sources included in Austin's 2015 Community Diversion Study. 41.05% FY2019-20 Current CY 2018 1,079,312 402,292 80,906 Zero Waste Advisory Commission - October 14, 2020 Single Stream Recycling Statistical Report FY20: October 2019-August 2020 Texas Disposal Systems (TDS) and Balcones Resources, Inc. (BRI) Month and Year Contractor Tons Delivered Contractor Payments Net Value to the City Landfill Cost Avoidance Revenue Processing Cost Net Amount Due/(Owed) $ per ton value Cost Per Ton Total October 2019 November 2019 December 2019 January 2020 February 2020 March 2020 April 2020 May 2020 June 2020 July 2020 August 2020 TDS BRI TDS BRI TDS BRI TDS BRI TDS BRI TDS BRI TDS BRI TDS BRI TDS BRI TDS BRI TDS BRI Total Total Total Total Total Total Total Total Total Total Total 1,939.98 2,982.78 4,922.76 1,753.88 2,816.24 4,570.12 2,346.49 2,808.82 5,155.31 1,994.14 3,584.11 5,578.25 1,761.00 2,566.90 4,327.90 2,297.58 2,811.25 5,108.83 2,438.65 3,432.02 5,870.67 2,250.47 3,457.47 5,707.94 2,723.58 3,080.17 5,803.75 2,031.04 3,655.56 5,686.60 2,258.41 2,897.31 5,155.72 $44,128 $40,533 $84,661 $43,495 $41,361 $84,856 $61,255 $43,110 $104,365 $54,872 $59,448 $114,321 $44,898 $43,932 $88,830 $55,228 $46,526 $101,754 $67,181 $61,906 $129,088 $77,502 $80,108 $157,610 $84,324 $62,228 $146,551 $58,786 $66,359 $125,145 $70,507 $58,664 $129,171 $175,568 $215,984 $391,552 $158,726 $206,158 $364,884 $212,357 $205,720 $418,078 $180,470 $249,126 $429,596 $159,371 $191,447 $350,818 $207,931 $205,863 $413,794 $220,698 $240,761 $461,459 $203,668 $242,161 $445,828 $246,484 $221,409 $467,893 $183,809 $253,056 $436,865 $204,386 $210,941 $415,328 ($131,440) ($175,451) ($306,891) ($115,231) ($164,797) ($280,028) ($151,103) ($162,610) ($313,713) ($125,597) ($189,678) ($315,275) ($114,473) ($147,515) ($261,988) ($152,703) ($159,337) ($312,040) ($153,517) ($178,854) ($332,371) ($126,166) ($162,053) ($288,219) ($162,160) ($159,182) ($321,342) ($125,023) ($186,697) ($311,720) ($133,879) ($152,278) ($286,157) ($67.75) ($58.82) $22.93 $22.93 ($65.70) ($58.52) $22.93 $22.93 ($64.40) ($57.89) $22.93 $22.93 ($62.98) ($52.92) $22.93 $22.93 ($65.00) ($57.47) $22.93 $22.93 ($66.46) ($56.68) $22.93 $22.93 ($62.95) ($52.11) $22.93 $22.93 ($56.06) ($46.87) $22.93 $22.93 ($59.54) ($51.68) $22.87 $22.87 ($61.56) ($51.07) $22.87 $22.87 ($59.28) ($52.56) $22.87 $22.87 $44,484 $68,395 $112,879 $40,216 $64,576 $104,793 $53,805 $64,406 $118,211 $45,726 $82,184 $127,909 $40,380 $58,859 $99,239 $52,684 $64,462 $117,145 $55,918 $78,696 $134,614 $51,603 $79,280 $130,883 $62,288 $70,443 $132,732 $46,450 $83,603 $130,053 $51,650 $66,261 $117,911 FY20 Totals 57,887.85 $1,266,351 $4,596,095 ($3,329,743) $1,326,370 To: From: Zero Waste Advisory Commission Ken Snipes Director Austin Resource Recovery Date: September 9th, 2020 (Canceled) Subject: Director’s Monthly Report to the Zero Waste Advisory Commission Austin Resource Recovery FY 2020-21 Approved Budget Highlights The Department’s approved operating budget increases by approximately 1.2% or $1.3M in the upcoming fiscal year. This amount includes $1.5M for new positions: ten Operators, one Inventory Control Specialist, and the addition of eight positions to form a Clean Creeks Program. Major Citywide cost drivers add over $1.1M* to the budget, while major department-wide cost drivers are reduced by almost $1.2M. ARR’s approved budget includes funding for increased temporary employees, additional office space, and increased Fleet fuel and maintenance expenses, along with other smaller increases. Major reductions to the ARR budget include a significant decrease in debt service payments due to repaid debt, a decrease in capital appropriations due to one-time Capital Fund transfers within the Clean Community Fee budget amendment, and a significant reduction in funding for the Department’s Master Plan as it nears completion. * Dollar figures may not align as only major changes (greater than $100k) are summarized. FY 2020-21 Approved Operating Budget Revenue Requirements Ending Balance FTEs FY 2019 Budget FY 2020 Amended FY 2021 Approved $93,877,367 $97,121,281 $103,880,851 $97,093,137 $105,491,746 $106,810,355 $9,439,160 $9,439,160 $9,286,579 464.00 482.00 501 Capital Appropriations $10,110,280 $12,326,500 $11,710,005 Highlights of Approved Budget Citywide Cost Drivers ❑ Additional funding for full-time employee wages and benefits ❑ Supplemental pension contribution ❑ Citywide Support Services transfers Departmentwide Cost Drivers ❑ Administrative office space ❑ New full-time employees: ten operators to support curbside compost expansion, trash, and recycling, and one inventory control specialist for carts ❑ Clean Creeks Program ❑ Temporary employees across the department ❑ Fleet maintenance and fuel expense ❑ Vehicle advertising – wraps ❑ Austin Material Marketplace: ARR contribution ❑ Truck Wash and Lubrication Agreement cancelled ❑ Reduction to cart purchases ❑ Reduction to Business Outreach: online reporting database FTEs Requirements $967,318 $260,695 ($103,680) $811,032 $776,642 11.0 8.0 $670,000 $348,383 $179,707 $140,000 ($100,500) ($210,000) ($304,815) ($314,312) ($350,000) ($616,495) ($1,324,047) and advertising ❑ Master Plan revision ❑ Transfer to Capital Fund ❑ GO Debt Service Major Rate Changes Requested Service Description Curbside Collection Amended FY 2019-20 Approved FY 2020-21 Change Base Customer Charge Residential $14.70 per month $17.30 per month $2.60 Base Customer Charge Commercial $14.70 per month $17.30 per month $2.60 Trash Cart Charges Each 96 Gallon Cart Residential $28.80 per month $30.70 per month $1.90 Each 96 Gallon Cart Commercial $28.80 per month $30.70 per month $1.90 Damaged Cart Fee - $45 New Fix-It At Home Series To continue to provide repair education while in-person Fix-It Clinics are suspended, the Circular Economy Program has been hosting Fix-It At Home!, a free online series of interactive workshops teaching basic repair skills taught by paid local instructors this summer. As of August 26th, we’ve hosted 9 classes on topics such as sewing repairs by hand, sewing machine basics, bicycle maintenance, and guitar adjustments. A total of 107 people have attended the series online so far. The program has been well-received, with 93% of post-event survey respondents rating their overall satisfaction as an 8, 9, or 10. (on a scale of 1-10). An additional 11 classes remain, including Spanish-language classes. The program will make videos from the workshops available online for ongoing repair education. Upcoming classes can be found at http://austintexas.gov/fixit 2020 Service Day Change Austin Resource Recovery has initiated a curbside collection day change for 9,413 customers (4.5%) beginning the week of September 21. This modification aims to rebalance routes and maximize route efficiencies by making fewer trips to the landfill and processing facilities, reducing wear and tear on collections vehicles, shortening excessively long workdays for operations staff and ultimately providing better customer service. Customers affected by the change have already been notified with a letter and email, but the department is also notifying customers via a reminder postcard, hand-delivered cart tags, a press release, and with alerts to Austin Recycles App and MySchedule subscribers. A memo to Mayor and Council was sent in August ARR Solicitations Update As of August 21, 2020 ZWAC Meeting September 9, 2020 Upcoming Solicitations Under Development (in alphabetical order): No Updates Solicitations Expected to be Posted Within the Next 90 Days: 1. Daily Drop-Off of Material Collected Through Dumpster or Roll-Off Service: IFB – Contractor to receive daily collections of bulk materials from the City at their disposal facility or landfill. No existing contract. 1. Education, Cleanup, and Beautification Services: RFP – Contractors qualified to provide education, cleanup, and beautification services that benefit the public by improving Austin’s environment and aesthetics through a variety of programs and providing resources and education that inspire Austin residents toward effective environmental stewardship. Link to current contract. 2. Electronics Recycling: IFB – Contractor to pick up, transport, and recycle computers, monitors, televisions, and other devices that operate using electrical parts in an environmentally sound manner. Link to current contract. 3. Post-Disaster Debris Removal Services: RFP – Contractor to provide emergency debris removal services in accordance with Federal Emergency Management Administration (FEMA) guidelines. No existing contract. 4. Post-Disaster Debris Monitoring Services: RFP – Contractor to provide emergency field debris monitoring services to include management and accounting services for monitoring the recovery efforts of the City’s Post Disaster Debris Removal Contractor. No existing contract. Published Solicitations: No Updates Solicitations in Evaluation or Negotiation: 1. Recycling Processing for Non-Curbside Collections: IFB 1500 SLW1043 – This posted on June 15, 2020 and closed on July 28, 2020. Contractor to provide single-stream recyclable material processing and marketing services to sort, process, store, market, and sell single-stream recyclable material. The Contractor shall be responsible for picking up the recyclable material collected at the Recycle and Reuse Drop-off Center and receiving the recyclable material collected by ARR from City facilities. This is replacing two contracts: In-House Recycling and RRDOC Recycling. 2. Routine Non-Residential (City facilities) Dumpster Collection Services: IFB 7400 SLW1035 – Contractor to collect trash, recycling, brush, bulk, and compostable Materials from City of Austin facilities. Scope may also include special event and emergency service needs at City facilities on an as-needed basis. RFI 1500 SLW6005 was issued in July 2019 related to these services. Solicitation posted March 9, 2020 and closed April 7, 2020. Link to current contract Definitions: CCO (Capital Contracting Office): Administers the procurement of professional and construction services. CO-OP (Cooperative Contract): A contract that has been competitively bid and issued by another government or purchasing alliance with the intention of sharing it with other governmental entities. IFB (Invitation for Bid): Formal bidding documents inviting suppliers to submit pricing for goods or services. RFI (Request for Information): Used to obtain industry input, feedback, or reactions from potential suppliers prior to issuing a solicitation. RFQ (Request for Quotation): Informal request to suppliers to provide quotes on specific goods or services. RFQS (Request for Qualifications): Formal solicitation used when qualifications are the main criteria for professional services. RFP (Request for Proposals): Formal request for a supplier to provide a solution and cost estimate to a complex need. Page 1 of 1 Austin Resource Recovery Curbside Collection and Drop Off Center Operations LAST FISCAL YEAR CURRENT FISCAL YEAR FY 2018 FY 2019 May 2019 Jun 2019 May 2020 Jun 2020 FY19 YTD (Oct 18-Jun 19) FY20 YTD (Oct 19-Jun 20) 128,829 10,231 528 130,307 11,040 517 11,970 1,515 63 10,490 1,329 42 98,357 7,339 378 12,029 12,426 100,809 Description of Services Tons of curbside Trash Tons of Curbside Bulk Disposed HHW Operations Tons Disposed Estimated Tons of Curbside Recycling Total Disposed Tons Collected Curbside and Residuals* 10,642 11,761 1,013 877 8,639 1,018 1,031 8,381 10,670 from Drop Off Center Operations 150,230 153,625 14,561 12,739 114,713 13,091 13,564 114,003 154,024 *Estimated tons of curbside recycling processed by vendors as residual - based on bi-annual sample route audit i d e s o p s D s n o T d e i t r e v D s n o T Tons of curbside recycling RRC Tons Recycled/Reused RRC Tons of Brush Collected HHW Operations Tons recycled/reused Tons of Drop Off Center Collections Recycled/Reused Tons of Curbside Yard Trimmings Tons of Curbside Bulk Recycled Tons of Curbside Brush Collected Tons of Curbside Textiles Collected Tons of Carts Recycled Total Diverted Tons Collected Curbside and from Drop Off Center Operations Tons of Curbside Compost Collected** 48,005 1,986 1,505 469 3,759 32,244 201 6,292 150 154 90,805 14,414 47,528 2,259 2,595 477 5,073 37,265 257 6,447 77 166 96,813 22,040 4,330 201 350 46 571 3,543 26 583 8 18 9,080 2,093 3,789 182 218 43 411 2,711 32 717 5 0 7,665 1,670 36,494 1,663 2,037 357 3,879 31,368 178 4,527 77 116 76,639 18,047 **"Tons of Curbside Compost Collected" is included in the "Tons of Yard Trimmings Collected" Total Tons Collected Curbside and from Drop Off FY 2020 Goal 132,546 10,248 560 50,250 2,600 2,500 560 5,450 37,500 210 7,373 157 175 101,115 31,300 44 0 0 0 0 0 0 43 0 0 71 36 59 93 5 0 33 0 18 4,690 4,773 4,529 157 3,747 9,262 3,696 8,728 3,101 4,548 265 38,664 1,133 1,676 201 2,910 39,151 100 2,907 0 150 83,882 31,162 Center Operations 241,035 250,438 23,641 20,403 191,352 22,353 22,292 197,885 255,139 Estimated Percent of Curbside Collected Materials Diverted from Landfills by ARR 36.77% 37.47% 36.98% 36.36% 38.89% 41.44% 38.78% 41.59% 38.05% Pounds of Trash collected per customer per pickup 24.84 24.78 27.25 23.85 25.00 26.98 27.75 25.21 24.92 Number of Trash and Recycling Customers 199,448 202,292 202,716 203,017 201,742 205,804 206,680 205,038 204,549 customer per pickup (every other week) 18.62 18.17 19.83 17.33 18.66 21.16 21.44 19.45 18.99 Pounds of Recycled materials collected per Pounds of Yard Trimmings collected per customer per week 6.25 7.12 8.11 6.20 8.02 10.21 8.41 9.85 7.09 Number of Yard Trimmings/Organics Customers 198,325 201,174 201,600 201,861 200,636 204,640 205,527 203,882 203,508 Total tons of Dead Animals Collected from COA rights- of-way and the animal shelter 36 30 2 3 23 3 4 26 32 25,000 20,000 15,000 10,000 5,000 0 55% 50% 45% 40% 35% 30% 25% 45.00% 40.00% 35.00% 30.00% 25.00% Austin Resource Recovery Curbside Collection and Drop Off Center Operations 23,641 20,403 22,353 22,292 9,080 7,665 9,262 0 8,728 May 2019 Jun 2019 May 2020 Jun 2020 Total Diverted Tons Collected Curbside and from Drop Off Center Operations Total Tons Collected Curbside and from Drop Off Center Operations Estimated Percent of Curbside Collected Materials Diverted from Landfills by 0 0 ARR 37% 36% 39% 39% 41% 42% May 2019 Jun 2019 FY19 YTD (Oct 18-Jun 19) May 2020 Jun 2020 FY20 YTD (Oct 19-Jun 20) Reporting Status and Diversion Results for All Categories of Waste Generation Category of Waste Generation Residential Waste Diversion (city serviced accounts) Community Diversion Rate FY2015-16 FY2016-17 FY2017-18 FY2018-19 FY2019-20 FY2019-20 Actual 37.60% 42.02% Actual 37.51% * Actual 36.77% * Actual 37.47% * Goal 38.05% * Current 41.59% * *As prescribed in the Austin Resource Recovery Master Plan, the Department will conduct a detailed waste assessment study every five years to determine progress toward our Zero Waste goal. The first such study was published in 2015 and is titled Austin’s 2015 Community Diversion Study. The study focused on estimating diversion from both ARR-serviced properties and commercial properties. Commercial properties include retail businesses, food service establishments, professional offices, industrial properties, institutional facilities, government facilities, and multifamily properties five units and larger. According to Austin's 2015 Community Diversion Study, Residential Waste Diversion Rate (city serviced accounts) represents approximately 15% and the Community Diversion Rate (accounts serviced by private waste haulers) represents approximately 85% of the total citywide wastage. Residential Waste Diversion (city serviced accounts) 37.60% 37.51% 36.77% 37.47% 38.05% FY2015-16 Actual FY2016-17 Actual FY2017-18 Actual FY2018-19 Actual FY2019-20 Goal Category of Waste Generation Commercial Tons Landfilled** Commercial Tons Recycled** Commercial Organics Tons** CY 2016 CY 2017 1,152,661 360,244 206,165 1,708,484 722,573 97,173 1,079,312 402,292 80,906 ** Numbers reported here are compiled from self-reported data submitted by licensed private waste haulers via semi-annual tonnage reports required under Section 15-6-3 of the City Code on a calendar year basis and as such, ARR does not attest to the accuracy of these amounts. These numbers reflect data from 100-200 licensed haulers (number of haulers varies over time), and include haulers servicing dumpsters, roll-offs, construction and demolition debris, landscaping debris, and metal scrap. These numbers do not reflect all data sources included in Austin's 2015 Community Diversion Study. 41.59% FY2019-20 Current CY 2018 Zero Waste Advisory Commission - September 9, 2020 Single Stream Recycling Statistical Report FY20: October 2019-July 2020 Texas Disposal Systems (TDS) and Balcones Resources, Inc. (BRI) Month and Year Contractor Tons Delivered Contractor Payments Net Value to the City Landfill Cost Avoidance Revenue Processing Cost Net Amount Due/(Owed) $ per ton value Cost Per Ton Total October 2019 November 2019 December 2019 January 2020 February 2020 March 2020 April 2020 May 2020 June 2020 July 2020 TDS BRI TDS BRI TDS BRI TDS BRI TDS BRI TDS BRI TDS BRI TDS BRI TDS BRI TDS BRI Total Total Total Total Total Total Total Total Total Total 1,939.98 2,982.78 4,922.76 1,753.88 2,816.24 4,570.12 2,346.49 2,808.82 5,155.31 1,994.14 3,584.11 5,578.25 1,761.00 2,566.90 4,327.90 2,297.58 2,811.25 5,108.83 2,438.65 3,432.02 5,870.67 2,250.47 3,457.47 5,707.94 2,723.58 3,080.17 5,803.75 2,031.04 3,655.56 5,686.60 $44,128 $40,533 $84,661 $43,495 $41,361 $84,856 $61,255 $43,110 $104,365 $54,872 $59,448 $114,321 $44,898 $43,932 $88,830 $55,228 $46,526 $101,754 $67,181 $61,906 $129,088 $77,502 $80,108 $157,610 $84,324 $62,228 $146,551 $58,786 $66,359 $125,145 $175,568 $215,984 $391,552 $158,726 $206,158 $364,884 $212,357 $205,720 $418,078 $180,470 $249,126 $429,596 $159,371 $191,447 $350,818 $207,931 $205,863 $413,794 $220,698 $240,761 $461,459 $203,668 $242,161 $445,828 $246,484 $221,409 $467,893 $183,809 $253,056 $436,865 ($131,440) ($175,451) ($306,891) ($115,231) ($164,797) ($280,028) ($151,103) ($162,610) ($313,713) ($125,597) ($189,678) ($315,275) ($114,473) ($147,515) ($261,988) ($152,703) ($159,337) ($312,040) ($153,517) ($178,854) ($332,371) ($126,166) ($162,053) ($288,219) ($162,160) ($159,182) ($321,342) ($125,023) ($186,697) ($311,720) ($67.75) ($58.82) $22.93 $22.93 ($65.70) ($58.52) $22.93 $22.93 ($64.40) ($57.89) $22.93 $22.93 ($62.98) ($52.92) $22.93 $22.93 ($65.00) ($57.47) $22.93 $22.93 ($66.46) ($56.68) $22.93 $22.93 ($62.95) ($52.11) $22.93 $22.93 ($56.06) ($46.87) $22.93 $22.93 ($59.54) ($51.68) $22.87 $22.87 ($61.56) ($51.07) $22.87 $22.87 $44,484 $68,395 $112,879 $40,216 $64,576 $104,793 $53,805 $64,406 $118,211 $45,726 $82,184 $127,909 $40,380 $58,859 $99,239 $52,684 $64,462 $117,145 $55,918 $78,696 $134,614 $51,603 $79,280 $130,883 $62,288 $70,443 $132,732 $46,450 $83,603 $130,053 FY20 Totals 52,732.13 $1,137,181 $4,180,767 ($3,043,587) $1,208,458