02.01 Cost of Moter Vehicle Crashes Presentation — original pdf
Backup

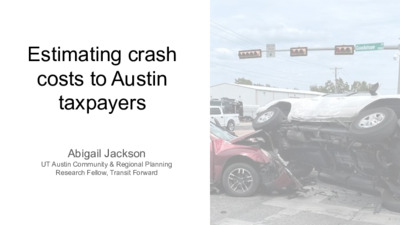
Estimating crash costs to Austin taxpayers Abigail Jackson UT Austin Community & Regional Planning Research Fellow, Transit Forward Background ● Austin’s Strategic Mobility Plan (2019) sought to expand transit usage in order to address multiple challenges facing the city, including the high societal and economic costs of motor vehicle crashes (MVC) ● MVC was top cause of death in 2020 for those 15-24 and in the top four for those 25-44 according to TX Dept of State Health Services ● Estimated to cost Austin’s economy between $350 million to $500 million in 2019 When assessing the costs and benefits of implementing Project Connect and striving for 50/50 mode share, Taxpayers should be aware of the potential for savings through reduced motor vehicle crash costs Crash Costs Estimation Process National Highway Traffic Safety Administration framework 1. Understand crash counts per year, categorized by injury type 2. Calculate per-crash costs in 10 cost categories–e.g. Medical, EMS, private and public property damage 3. Adjust per-crash costs to fit Austin economic context and adjust for inflation 4. Calculate total costs by payee (e.g. public vs. individual costs), 5. Divide government payment by number of ATX households And pulse check along the way. E.g. estimate shows damage to public property such as medians and guardrails in 2022 cost around $845,372.09. We know for a fact in 2023 we spent $470,000.00 on knockdowns of traffic poles alone, so that number sounds logical or too low Crash Cost Estimates 2019-2022: Large variations Year Total State/Local Cost of Austin Crashes Total State/Local Cost of Austin Crashes (2022 dollars) Cost per Austin HH (2022 dollars) Total savings at 50/50 mode share (x 24%) Total savings per Austin HH 2019 $31,900,597.29 $35,242,365.03 $92.65 $8,458,167.61 $22.24 2020 $26,631,715.82 $28,994,175.95 $73.35 $6,958,602.23 $17.60 2021 $31,647,249.33 $34,114,444.61 $84.42 $8,187,466.71 $20.26 2022 $36,199,324.52 $36,199,324.52 $85.56 $8,687,837.89 $20.53 Real (inflation-adjusted) annual growth of: 1% 2019-2022 6% 2021-2022 2040 Projected Costs Austin population projections predict an annual growth rate around 1.3%, so 423,079 households in 2022 may grow to 533,815 in 2040 Say motor vehicle crash costs grow just 3.5% YoY, Austin may be spending $67,239,854.18 total ($88.19/HH in 2022 dollars) that year in MVC costs At 50/50 mode share, savings of $16,137,565.00 total ($21.16/HH in 2022 dollars) Austin taxpayers should see their tax dollars shift from MVC costs towards programs making Austin a better place once overall count of crashes is reduced. Approaching 50/50 mode share may see even steeper drop-offs in costs with fewer cars on the road increasing safety and reducing rates of crashes (elastic growth in safety)