Safe Routes to School Slides — original pdf
Backup
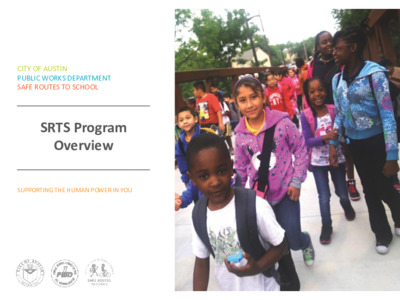
CITY OF AUSTIN PUBLIC WORKS DEPARTMENT SAFE ROUTES TO SCHOOL SRTS Program Overview SUPPORTING THE HUMAN POWER IN YOU Mission Vision To increase the number of students walking and biking to school by creating a safer, healthier and more equitable environment that fosters human-powered transportation Engage with the community to create a safer, healthier and more equitable environment that fosters human powered transportation as the first choice for City of Austin students. City of Austin | Public Works Department | Safe Routes to School 2 Programming Infrastructure Education Crossing Guards Engagement City of Austin | Public Works Department | Safe Routes to School 3 Programming Infrastructure Education Crossing Guards Engagement City of Austin | Public Works Department | Safe Routes to School 4 Infrastructure Program 2016 Bond Language voted on by Austin Voters: $27,500,000 divided evenly among the ten City Council Districts to allow the City to address Safe Routes to School. The Safe Routes to School Program is a partnership with local school districts to address safety concerns of routes to school and encourage children and families to bike or walk to school. Improvements may include infrastructure options that create a safer environment such as sidewalks, traffic calming devices, protected bicycle facilities, and urban trails. Approach: Initial Ask of School Concerns Internal Review Three Week Comment Period Walk Audits and Community Meetings Release of Draft Infrastructure Report Final Infrastructure Report City of Austin | Public Works Department | Safe Routes to School 5 Walk Audits Per Council District Council District 1 Council District 6 Council District 2 Council District 7 Council District 3 Council District 8 Council District 4 Council District 9 18 18 14 15 9 18 13 14 8 11 Council District 5 Council District 10 City of Austin | Public Works Department | Safe Routes to School 6 Number of Barriers Identified Per Council District 609 573 425 426 467 520 524 405 371 334 700 600 500 400 300 200 100 0 District 1 District 2 District 3 District 4 District 5 District 6 District 7 District 8 District 9 District 10 City of Austin | Public Works Department | Safe Routes to School 7 Estimated Cost of Barriers Per Council District $140,000,000 $120,000,000 $121,700,000 $100,000,000 $97,100,000 $89,500,000 $92,500,000 $110,700,000 $68,100,000 $73,700,000 $66,700,000 $52,100,000 $53,000,000 $80,000,000 $60,000,000 $40,000,000 $20,000,000 $- District 1 District 2 District 3 District 4 District 5 District 6 District 7 District 8 District 9 District 10 City of Austin | Public Works Department | Safe Routes to School 8 Benefit Analysis Demand (35%): • • Schools within .5 miles Students Served (Network Analysis) Equity (20%): • Free and reduced eligibility rate • Poverty Rate Safety (30%): • Bike/Ped Crashes • • Functional Class Score Engineering Judgement Stakeholder Input (15%): • WikiMap Comments • Public Comment City of Austin | Public Works Department | Safe Routes to School 9 Infrastructure Report Breakdown • Background • Process • Overall Benefit and Estimated Cost:Benefit Chart • Recommendations by School City of Austin | Public Works Department | Safe Routes to School 10 Guiding Principles 1) 3) 4) Implement projects that have a High or Very-High Overall Benefit or a High or Very-High Estimated Cost:Benefit. 2) Make meaningful walking and bicycling improvements near as many schools as possible. For 2016 Mobility Bond funding, balance funding equally per district, as voted on by the public. Leverage other available sources of funding to implement additional projects. City of Austin | Public Works Department | Safe Routes to School 11 Total Spending Through FY 2022 Q3 Quarter Goal (Cumulative) Actual % to Goal Variance Fiscal YR Approved Baseline 2018 $1,000,000 2019 $2,500,000 2020 $5,100,000 2021 $5,600,000 2022 $5,500,000 Q1 Q2 Q3 Q4 Q1 Q2 Q3 Q4 Q1 Q2 Q3 Q4 Q1 Q2 Q3 Q4 Q1 Q2 Q3 Q4 $432,203 $682,203 $932,203 $1,182,203 $1,807,203 $2,432,203 $3,057,203 $3,682,203 $4,523,514 $5,798,514 $7,218,077 $8,782,203 $10,182,203 $11,582,203 $12,982,203 $15,757,203 $17,132,203 $18,507,203 $19,882,203 $654,774 $1,127,345 $1,599,916 $2,072,490 $2,188,982 $2,505,135 $2,951,482 $3,508,872 $4,109,109 $4,412,680 $4,875,884 $6,352,050 $7,629,027 $7,981,040 $9,481,030 $13,161,718 $14,579,354 $16,463,907 $14,382,203 $11,721,051 151% 165% 172% 175% 121% 103% 97% 95% 91% 76% 68% 72% 75% 69% 73% 81% 84% 85% 89% $222,571 $445,142 $667,713 $890,287 $381,779 $72,932 ($105,721) ($173,331) ($414,405) ($1,385,834) ($2,342,193) ($2,430,153) ($2,553,176) ($3,601,163) ($3,501,173) ($2,661,152) ($2,595,485) ($2,552,849) ($2,043,296) City of Austin | Public Works Department | Safe Routes to School 12 Spending by Council District District Iteration to Date 1 2 3 4 5 6 7 8 9 10 $1,506,405 $1,118,105 $1,579,630 $1,225,977 $1,369,526 $1,068,815 $2,141,728 $536,321 $1,377,773 $1,206,417 City of Austin | Public Works Department | Safe Routes to School 13 Leveraging of Funds (Partnerships) • Urban Trails • Neighborhood Partnering • Corridor Program • Independent School Districts (Austin, Round Rock, Pflugerville, Leander, Manor, Eanes, Del Valle) • Capital Metro • Quarter-Cent Funding Program • Sidewalks • Street and Bridge Operations • Bikeways • Signals • Speed Management • Vision Zero • Pedestrian Crossing Program City of Austin | Public Works Department | Safe Routes to School 14 Schools and Projects Totals • 97 schools received some type of improvements (71% of 137 total schools) • Over 300 projects completed as of July 1, 2022 • 251 projects planned City of Austin | Public Works Department | Safe Routes to School 15 2020 Bond Language $20M was allocated to address barriers identified in the SRTS Infrastructure Reports with a focus on Very High and High Benefit and/or Cost Benefit Projects. This funding does not need to be split evenly so we will be focusing more on Equity. City of Austin | Public Works Department | Safe Routes to School 16 Future Planning The SRTS Infrastructure Report was focused on Public Elementary and Middle schools in Austin as they had a catchment area which allowed us to run a demand analysis. We are recommending to help address equity concerns that approximately $1M of the $20M be put aside to address issues at Charter Schools which have been continued to be built in Low SES areas. City of Austin | Public Works Department | Safe Routes to School 17 Coleen Gentles Infrastructure Manager Safe Routes to School Program Public Works Department City of Austin Phone: 512-974-7338 Email: Coleen.Gentles@austintexas.gov City of Austin | Public Works Department | Safe Routes to School 18