Item 2A( Final Draft) ATD Budget Overview FY 23 — original pdf
Backup

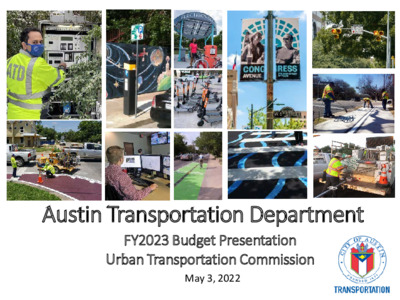
Austin Transportation Department FY2023 Budget Presentation Urban Transportation Commission May 3, 2022 2016 Corridor Program Office 2020 ATP Cord. Office Manage Demand & Operations Deliver New Capacity Deliver Transportation Networks Focus on Increasing Safety Maintain assets Generate revenue Regional Proj/Agency Coord. ATD’s Increasing Assets - 5,000+ Miles of Roadway Markings - 36,500+ Specialty Markings - 6,800+ Delineators - 100,000+ Street Signs - 6,250+ Crosswalks - 900+ Signalized Intersections - 600+ Flashing School Beacons - 300+ ADA Accessible Signals and PHBs - 280+ Miles of Bikeways - 100+ MetroBike Stations - 800+ On-Street Pay Stations 2 Types of ATD Fees O&M ATD Grant match CIP ROW Permits Traffic Control Plan Review Transportation Development Services Limo, Taxi, Pedicab Micromobility (scooters, bicycles, moped) Transportation User Fee Cost of service Development Fees Transportation Permits Parking Meters Valet Space and Sidewalk Cafes Use of City Right of Way (streets, sidewalks, curbspace) Rent ROW based on square feet and # of Days 3 ATD Departmental Summary Total Revenue is increasing by $23.7M Mobility Fund o Increase in TUF Residential and Commercial: $9.0M (equal to a $0.85/month increase for residential customers) o Increased revenue from Right-of-Way and other fees: $13.4M Parking Management Fund o Increased revenue from Parking Meters, Permitting, Parking and Transportation Management Districts (PTMD), Micro-Mobility: $1.2M Major Fee/Rate Description Transportation User Fee (Public Works) Transportation User Fee (ATD) Total * Per single-family home FY 2022 Rate * FY 2023 Proposed Rate* Monthly Change $9.75 $5.21 $14.96 $11.24 $6.06 $17.30 $1.49 $0.85 $2.34 4 Sources of Funds Department Revenue: FY22 Estimated: $76.8 million FY23 Proposed: $102.2 million* $44.7 $34.6 $34.3 $21.2 $17.9 $15.7 $50.0 $45.0 $40.0 $35.0 $30.0 $25.0 $20.0 $15.0 $10.0 $5.0 $0.0 ) s n o i l l i m $ ( Transportation User Fee Parking Fees Licenses/ Permits FY22 Estimated FY23 Proposed $4.5 $4.5 Other $0.9 $0.9 General Fund 5 Department Expenditures: FY22 Estimated: $79.1 million FY23 Proposed: $105.8 million Use of Funds $26.3 $20.9 $20.0 $15.3 $30.0 $25.0 $20.0 $15.0 $10.0 $5.0 $0.0 ) s n o i l l i m $ ( $18.9 $13.3 $11.8 $10.2 $8.3 $13.3 $13.2 $9.3 $1.9 $2.1 Traffic Mgmt Parking Fund Trans Dev and Permits Support Services CPO Transfers Traffic Planning & Design FY22 Estimated FY23 Proposed 6 ATD Transportation Fund Balances $8.0 $7.0 $5.0 $3.0 $3.9 ) s n o i l l i m $ ( -$2.0 $4.0 $3.0 $2.4 $1.1 $1.9 $1.9 $2.2 $1.7 $1.2 $1.2 $1.3 $1.0 $1.2 $1.2 $1.3 FY18 FY19 FY20 FY21 FY22 (Est.) FY23 Forecast FY24 Forecast FY25 Forecast FY26 Forecast FY27 Forecast Mobility Fund Parking Fund $1.6 $1.1 7 FY23 Mobility Fund Summary - Proposed (in millions) FY21 Actual Beginning Balance Revenues Transfers In Expenditures Transfers Out & Other Ending Balance $10.5 $50.9 $ 0.9 $42.0 $13.6 $ 5.2 FY22 Estimated $ 5.2 FY23 Proposed $ 2.4 $60.2 $ 0.9 $50.6 $13.2 $ 2.4 $83.5 $ 0.9 $67.3 $18.4 $ 1.0 FTEs 279.5 308.5 335.5 +27.0 FTE 8 FY23 Parking Fund Summary - Proposed Beginning Balance Revenues Expenditures Transfers Out & Other Ending Balance (in millions) FY21 Actual $1.2 $13.0 $9.6 $1.5 $3.3 73.5 FY22 Estimated FY23 Proposed $3.3 $15.7 $10.4 $4.9 $3.8 $3.8 $17.9 $14.5 $5.5 $1.7 +10.0 FTE 9 FTEs 89.0 99.0 FY23 Parking Fund Investments FY22 CYE FY23 Proposed Great Streets (transfer to HAP) Transfer to GO Debt (Parking Kiosks for Others) Smart Mobility Projects PTMD Administrative Support Workers' Compensation Regional Radio CTM Support Liability Reserve Accrued Payroll Compensation Adjustment Total $728,385 $0 $2,195,000 $1,200,650 $504,397 $60,008 $43,102 $70,807 $2,000 $25,280 $66,691 $4,896,320 $728,385 $346,510 $2,000,000 $1,507,496 $529,616 $75,780 $45,167 $77,888 $2,000 $26,038 $114,579 $5,453,459 10 Capital Highlights FY 2023 Appropriation $11.0 million FY 2023 Spending Plan $230.1 million Key Projects: • IH-35 Coordination Projects • East Braker Lane Extension • 2020 Bond Substandard Streets • Ross Road North • Johnny Morris Road • Bradshaw Crossing • Nuckols Road • Slaughter Lane Signal Improvements 11 New CIP Fee – Street Impact Fee 12 Horizon Issues and Challenges Looking Beyond FY 2023… Vision Zero: Eliminate transportation-related injuries and fatalities o Focus on communication, design and speed management to reduce high crash rates and improve pedestrian and bicycle safety. o Need for greater coordination with State: 80% of severe injuries/fatalities occur on on-system (state) roadways “One System” Transportation System o Collaborate with regional partners to integrate and coordinate services to maximize future transportation investments including Project Connect (CTECC) Increase focus on Travel Demand Management (TDM) o Partner with Cap Metro, mobility providers and Movability to shift travelers away from single- occupancy vehicle trips to keep pace with urban growth Maintenance Funding o Bond funded projects and new infrastructure increases future maintenance needs Long-term Funding Stability and Sustainability o Current sources of funding are all established on current user paradigms. When these paradigms are disrupted, a new revenue source will be needed – continued diversification across funding sources is recommended 13 Discussion