Customer Energy Solutions FY 26 Savings Report — original pdf
Backup
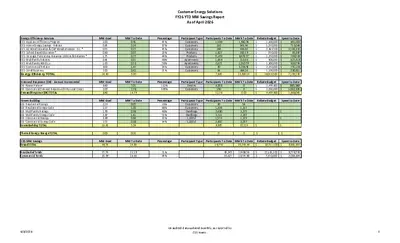
Customer Energy Solutions FY26 YTD MW Savings Report As of April 2026 Energy Efficiency Services EES- Appliance Efficiency Program EES- Home Energy Savings - Rebate EES- AE Weatherization & CAP Weatherization - D.I. * EES- School Based Education * EES- Strategic Partnership Between Utilities & Retailers * EES- Multifamily Rebates EES- Multifamily WX-D.I.+ EES- Commercial Rebate EES- Small Business Energy Efficiency TOTAL Demand Response (DR) - Annual Incremental DR- Power Partner DR- Commercial Demand Response (frmly Load Coop) Demand Response (DR) TOTAL Green Building GB- Residential Ratings GB- Residential Energy Code GB- Multifamily Ratings GB- Multifamily Energy Code GB- Commercial Ratings GB- Commercial Energy Code Green Building TOTAL MW Goal 2.00 0.65 0.55 0.30 1.75 0.65 1.00 6.00 2.00 14.90 MW Goal 6.40 2.00 8.40 MW Goal 0.29 2.15 1.90 2.67 3.89 2.53 13.43 MW To Date 0.91 0.24 0.25 0.07 0.77 0.31 0.58 1.45 0.42 5.00 MW To Date 7.01 7.78 14.79 MW To Date 0.05 1.00 0.88 1.41 0.84 0.86 5.04 Thermal Energy Storage TOTAL 0.00 0.00 Percentage 45% 37% 45% 23% 44% 48% 58% 24% 21% Percentage 110% 389% Percentage 18% 46% 46% 53% 22% 34% Participant Type Participants To Date MWh To Date Customers Customers Customers Products Products Apartments Apartments Customers Customers 1,366 230 284 1,627 71,452 1,639 2,425 60 34 7,665 1,930.94 343.94 464.40 365.19 6,373.57 710.36 1,010.59 3,736.91 694.24 15,630.14 Rebate Budget $ 1,200,000 $ 1,550,000 $ 5,613,500 $ 350,000 $ 1,250,000 $ 900,000 $ 1,800,000 $ 2,250,000 $ 1,100,000 $ 16,013,500 Spent to Date $ 641,000 $ 719,084 $ 2,583,390 $ 83,367 $ 769,589 $ 425,419 $ 889,784 $ 791,148 $ 290,811 $ 7,193,592 Participant Type Participants To Date MWh To Date Devices Customers 4,938 190 5,128 0 0 0.00 Rebate Budget $ 2,497,600 $ 2,000,000 $ 4,497,600 Spent to Date $ 665,160 $ 1,002,885 $ 1,668,045 Participant Type Participants To Date MWh To Date Rebate Budget Spent to Date Customers Customers Dwellings Dwellings 1,000 sf 1,000 sf 80 1,204 2,460 3,221 1,574 2,887 6,965 0 54 1,215 2,275 2,237 1,273 3,057 10,113 $ - $ - $ - $ - 0 $ - $ - CES MW Savings Grand TOTAL Residential Totals Commercial Totals MW Goal 36.73 MW To Date 24.83 Percentage Participant Type Participants To Date MWh To Date 19,758 25,743.44 Rebate Budget $ 20,511,100 Spent to Date $ 8,861,637 15.74 20.99 11.19 13.63 71% 65% 85,245 10,425 12468.56 13274.88 $ $ 15,161,100 5,350,000 $ $ 6,776,793 2,084,844 6/8/2026 Unaudited data updated monthly, as reported by CES teams. 3 Customer Energy Solutions FY26 YTD MW Savings Report As of April 2026 Participant Type Participants To Date MWh To Date Incentive Budget $ 2,500,000 $ 5,300,000 Customers Customers Spent to Date 840,000 1,673,179 336 21 81 438 5,009 6,125 1,922 11,134 $ 7,800,000 $ 2,513,179 MW Goal 5.00 7.00 10.00 22.00 Participant Type Customers Customers Participant Type Customers Customers MW To Date 2.83 3.46 4.68 10.97 April Participants 20,685 431 21,116 April Participants 207 178 385 Percentage 57% 49% April MWh 14,077.00 51,528.85 65,605.85 April MWh 144.02 135.59 279.62 4/08/26 - Guided tour of the La Loma solar farm to UT's Renewable Energy class 4/21/26 - Guest speaker at ARR's Zero Waste Black Leader (ZWBL) April Meeting 4/22/26 - Tabled Green Building's Green by Design Workshop 4/25/26 - Tabled Earth Fest at ReStore Through March, 80% Single Family homes and 4 multifamily development (with a total of 947 units) receiving AEGB ratings are in SMART Housing developments in the AE service area. Customer Renewable Solutions Residential Commercial Unincentivized Solar Energy TOTAL GreenChoice Residential Commercial GreenChoice TOTAL Community Solar Market Rate CAP Community Solar TOTAL Energy Efficiency Programs Customer Renewable Solutions (Solar/Community Solar/GreenChoice) Green Building Notes: AE Weatherization budget excludes rollover. All numbers are unaudited and will be adjusted in line with financial updates. This report has historically been filtered by paid date per enrollment. Beginning June 2022 the EES data is filtered on payment authorization (approval) date. 6/8/2026 Unaudited data updated monthly, as reported by CES teams. 3 Customer Energy Solutions FY26 YTD MW Savings Report As of April 2026 MW Saving Goal Tracking Solar Goal Tracking 40.00 35.00 30.00 25.00 20.00 15.00 10.00 5.00 0.00 24.83 20.52 18.43 13.47 11.87 14.82 9.42 36.731 8.00 7.00 6.00 5.00 4.00 3.00 2.00 1.00 0.00 3.71 2.64 3.46 2.83 2.89 2.90 2.26 1.64 1.79 0.88 0.52 0.45 0.17 0.19 7.000 5.000 Oct Nov Dec Jan Feb Mar Apr May Jun Jul Aug Sep Oct Nov Dec Jan Feb Mar Apr May Jun Jul Aug Sep Actual Goal Res Actual Com Actual Res Goal Com Goal 6/8/2026 Unaudited data updated monthly, as reported by CES teams. 3