CES RMC Savings Report — original pdf
Backup
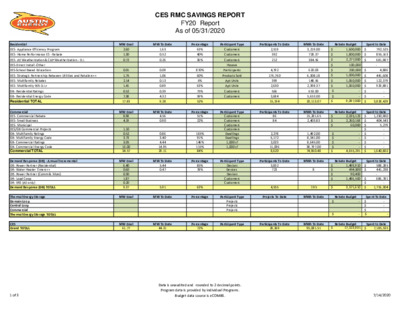
Residential EES- Appliance Efficiency Program EES- Home Performance ES - Rebate EES- AE Weatherization & CAP Weatherization - D.I. EES-Direct Install -Other EES-School Based Education EES- Strategic Partnership Between Utilities and Retailers++ EES- Multifamily Rebates EES- Multifamily WX-D.I.+ GB- Residential Ratings GB- Residential Energy Code Residential TOTAL Commercial EES- Commercial Rebate EES- Small Business EES- Municipal EES/GB Commercial Projects GB- Multifamily Ratings GB- Multifamily Energy Code GB- Commercial Ratings GB- Commercial Energy Code Commercial TOTAL Demand Response (DR) - Annual Incremental DR- Power Partner (Residential) DR- Water Heater Timers++ DR- Power Partner (Comm & Muni) DR- Load Coop DR- ERS (AE only) Demand Response (DR) TOTAL Thermal Energy Storage Domain Loop Central Loop Commercial Thermal Energy Storage TOTAL CES Grand TOTAL CES RMC SAVINGS REPORT FY20 Report As of 05/31/2020 MW Goal MW To Date Percentage Participant Type Participants To Date MWh To Date Rebate Budget MW Goal MW To Date Percentage Participant Type Participants To Date MWh To Date Rebate Budget 2.60 1.30 0.72 0.01 1.75 2.14 1.41 0.52 7.38 17.83 8.98 4.19 1.10 0.52 3.73 3.05 13.00 34.57 6.40 0.60 0.30 1.87 0.20 9.37 1.63 0.52 0.26 0.09 1.06 0.13 0.89 0.39 4.32 9.28 4.56 0.90 0.86 3.40 4.44 14.95 29.11 5.44 0.47 5.91 63% 40% 36% 870% 60% 6% 63% 75% 59% 52% 51% 22% 165% 91% 146% 115% 84% 85% 78% 63% Customers Customers Customers Houses Participants Products Sold Apt Units Apt Units Customers Customers Customers Customers Customers Customers Dwellings Dwellings 1,000 sf 1,000 sf Devices Devices Devices Customers Customers Projects Projects Projects 2,519 392 212 4,792 176,760 399 2,630 566 3,684 15,194 86 84 2,278 6,172 3,023 11,096 8,620 3,832 723 4,555 3,219.00 728.37 384.56 620.03 6,308.18 148.56 2,398.37 653.00 5,653.00 20,113.07 15,281.65 2,403.83 1,492.00 8,341.00 8,645.00 38,797.00 74,960.48 8 $ 1,600,000 $ 1,800,000 $ 2,277,000 $ 100,000 $ 200,000 $ 1,000,000 $ 1,060,000 $ 1,060,000 $ - $ - $ 9,097,000 $ 2,335,123 $ 2,260,168 $ 60,000 $ - $ - $ - $ - $ 4,655,291 $ 1,499,910 $ 494,800 $ 90,400 $ 1,486,500 Spent to Date 792,525 $ $ 855,163 681,987 $ - 4,886 441,608 122,379 929,881 $ $ $ $ $ - $ - $ 3,828,429 Spent to Date 1,230,980 404,543 5,279 $ $ $ - $ $ - $ - $ - $ - $ 1,640,802 Spent to Date $ 588,285 441,238 $ - 686,781 $ $ - $ 1,716,304 $ - $ - Spent To Date - $ - $ $ - $ - MW Goal MW To Date Percentage Participant Type Participants To Date MWh To Date Rebate Budget MW Goal MW To Date Percentage Participant Type Projects To Date MWh To Date Rebate Budget 7.95 $ 3,571,610 MW Goal 61.77 MW To Date 44.31 72% Percentage Participant Type Participants To Date 28,369 MWh To Date 95,081.51 Rebate Budget $ 17,323,901 Spent to Date 7,185,535 $ 1 of 3 7/14/2020 Data is unaudited and rounded to 2 decimal points. Program data is provided by individual Programs. Budget data source is eCOMBS. CES RMC SAVINGS REPORT FY20 Report As of 05/31/2020 Solar Energy Residential Commercial Solar Energy TOTAL Low Income Energy Efficiency Programs Solar Green Building MW Goal MW To Date Percentage Participant Type Participants To Date MWh To Date 7.00 5.00 12.00 5.82 0.26 6.09 83% 5% 51% Customers Customers 910 14 924 9739 435 10,173.53 Incentive Budgetǂ $ 3,000,000 $ 2,500,000 $ 5,500,000 Spent to Date 3,025,261 1,414,539 4,439,800 $ $ $ The framework for the program relaunch is nearing completion and we hope to be back weatherizing homes safely by July. Also, we continue to look for ways to broaden our reach to serve our customers more expeditiously. Explanation of Shelter in Place orders: Given the orders issued by the Governor and our city officials programs that did not involve essential work were halted in the interest of safety for our customers, contractors, and staff. • We enabled the billing for shared solar by hand while we continue to work on standing up Shared Solar to be fully functional in the billing system. • We are making progress working with ENGIE toward the implementation of a 1.5 MW solar project at ABIA that will serve to increase the subscription capacity for Community Solar. • We are developing strategies to presubscribe CAP customers to the Community Solar Program in advance to energizing ABIA. UPDATE In May, 51 of 101 Single Family homes receiving an AE Green Building rating are in SMART Housing developments in the AE service area. EES - LOAD COOP PROGRAM No. of Events 13 No. of Applicants Participants /Locations 55 474 Program Capacity MW 43.88 Maximum Event Performance MW 2Applicants and locations modified as a result of non performance and failure to activate contracts by end of fiscal year. 3Program Capacity is the sum of all participants' best 2018 Load Coop performance or expected maximum drop based on audit information. Includes T&D&SR. 4Best performance for any one event including 20% T&D&SR multiplier. DR Capacity Program Cycle Saver* Free Thermostat** Power Partner Thermostat Emergency Response System (AE only) EES Behavioral Programs PSV Newsletter & Outreach Residential App Commercial App Electric Vehicle Programs Commercial Charging Stations Residential Charging Stations E-Ride Devices/ Participants 22,408 11,384 35,294 - Units Participants Participants Participants Program Capacity (MW) 14.570 11.04* 50.12 0.20 Count 8,719 32,545 3,179 Rebates Spent To Date 5 28 4 $ $ $ 31,000.00 20,746.29 1,700.00 Loan Program EES- Home Performance ES-Loan* *The rebate loan program is used to provide Velocity loans with a reduced interest rate for customers who perform energy efficiency improvements (with approved credit). Program Spend 34,714 $ $ 200,000 Customers 7 Budget Includes cleared payments and pending payments. *Currently maintaining existing population of Cycle Saver water heater timers through replacement of units at 10 years. **Numbers based on M&V study summer of 2018. 2 of 3 7/14/2020 Data is unaudited and rounded to 2 decimal points. Program data is provided by individual Programs. Budget data source is eCOMBS. CES RMC SAVINGS REPORT FY20 Report As of 05/31/2020 Green Building Impacts Credited to Solar Energy Credited to Thermal Energy Storage Credited to Solar Energy Natural gas Building water Irrigation water Construction Waste diversion Units MW MW MWh CCF 1,000 gal 1,000 gal Tons Saved 1.430 103551.00 16889.00 16590.00 20685.00 EES/GB Water Savings Gallons/yr. at 0.45 Gallon/kWh 42,786,678 Avoided power plant water consumption (evaporation only). NOTES Above expenditures may include encumbrances. SPUR savings numbers are now audited for the previous month. Therefore, they are reported with a one month delay. Money spent on the DR-Cycle Saver program is funded from the DR Power Partner (Residential) Rebate Budget. Total commercial participation does not include GB commercial square foot. Thermal Energy Storage Budget is not part of Customer Energy Solutions Budget. *Currently maintaining existing population of Cycle Saver water heater timers through replacement of units at 10 years. **Numbers based on M&V study summer of 2016. Free thermostats were not adjusted in FY18 for attrition. ++Budgets maintained within other programs and tracked outside of eCOMBS. Goals and savings are calculated to included T&D line losses and spinning reserves. The ERS MW total is based on contracted and ERCOT-tested capacity. ERS now only reports incremental MW increases. ǂ Budget for Residential Solar includes incentives only Energy code savings from building permits are reported in the corresponding month one year post permit, thus Energy code savings from FY2019 building permits are reported in FY2020. 3 of 3 7/14/2020 Data is unaudited and rounded to 2 decimal points. Program data is provided by individual Programs. Budget data source is eCOMBS.