Special Meeting of the Resource Management Commission July 22, 2020 Resource Management Commission to be held on Wednesday July 22, 2020 at 3PM with Social Distancing Modifications Public comment will be allowed via telephone; no in-person input will be allowed. All speakers must register in advance by 12 noon on July 21, 2020. All public comment will occur at the beginning of the meeting. To speak remotely at the July 22, 2020 Resource Management Meeting, residents must: •Call or email the board liaison, Jamie Mitchell at 512/694-1073 or Jamie.mitchell@austinenergy.com no later than12 noon, Tuesday, July 21st. The information required is the speaker name, item number(s) they wish to speak on, whether they are for/against/neutral, and a telephone number or email address. •Once a request to speak has been called in or emailed to the board liaison, residents will receive either an email or phone call providing the telephone number to call on the day of the scheduled meeting. •Speakers must call in at least 15 minutes prior to meeting start in order to speak, late callers will not be accepted and will not be able to speak. •Speakers will be placed in a queue until their time to speak. •Handouts or other information may be emailed to Jamie.mitchell@austinenergy.com by noon the day before the scheduled meeting. This information will be provided to Board and Commission members in advance of the meeting. •If this meeting is broadcast live, residents may watch the meeting here: http://www.austintexas.gov/page/watch-atxn-live The City of Austin is committed to compliance with the American with Disabilities Act. Reasonable modifications and equal access to communications will be provided upon request. Meeting locations are planned with wheelchair access. If requiring Sign Language Interpreters or alternative formats, please call (512) 322-6450 at least 48 hours before the meeting date. TTY users route through Relay Texas at 711. For more information on the Resource Management Commission , please call Jamie Mitchell (512) 694-1073. RESOURCE MANAGEMENT COMMISSION Special Called Meeting July 22, 2020 Time: 3:00 PM– 4:30 PM VIA VIDEOCONFERENCING http://www.austintexas.gov/page/watch-atxn-live Austin, Texas MEMBERS: Dana Harmon, Chair (District 9) Kaiba White, Vice Chair (District 2) James Babyak (District 6) Jonathan Blackburn (District 8) Rebecca Brenneman (District 10) Lisa Chavarria (Mayor) Leo Dielmann (District 7) Nakyshia Fralin (District 1) Shane Johnson (District 4) Tom “Smitty” Smith (District 5) Vacant (District 3) AGENDA CALL TO ORDER CITIZEN COMMUNICATION: Speakers signed up by 12 noon on July …
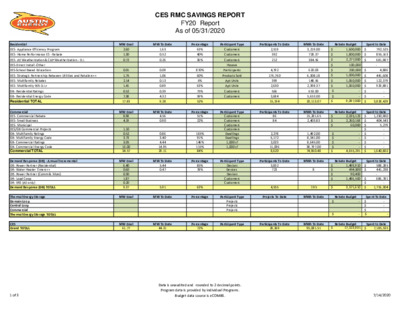
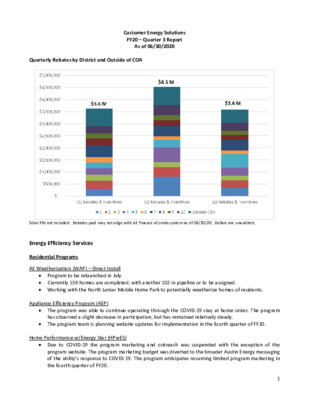
Customer Energy Solutions FY20 – Quarter 3 Report As of 06/30/2020 Quarterly Rebates by District and Outside of COA Solar PBI not included. Rebates paid may not align with AE Finance eCombs system as of 06/30/20. Dollars are unaudited. Energy Efficiency Services Residential Programs AE Weatherization (WAP) – Direct Install • Program to be relaunched in July. • Currently 159 homes are completed, with another 102 in pipeline or to be assigned. • Working with the North Lamar Mobile Home Park to potentially weatherize homes of residents. Appliance Efficiency Program (AEP) • The program was able to continue operating through the COVID-19 stay at home order. The program has observed a slight decrease in participation, but has remained relatively steady. • The program team is planning website updates for implementation in the fourth quarter of FY20. Home Performance w/Energy Star (HPwES) • Due to COVID-19 the program marketing and outreach was suspended with the exception of the program website. The program marketing budget was diverted to the broader Austin Energy messaging of the utility’s response to COVID-19. The program anticipates resuming limited program marketing in the fourth quarter of FY20. 1 • Due to COVID-19, the program’s new handbook and EECP configuration was not launched as planned in March of FY20. The program is monitoring the situation and will attempt to launch the new program at the start of FY21. • Despite COVID-19 the program was able to continue operating throughout the stay at home order. The program observed about a 30% drop in participation from the start of the stay at home order in March, but anticipates an increase in the fourth quarter of FY20. Demand Response Programs Power Partner Thermostat • 1,160 thermostats were enrolled in demand response this quarter. Load Coop/Automated Demand Response (ADR) • Trained AE staff on calling DR events with new DRAS. • Received approval on incentive structure updates. o Gives our customers more budget certainty when estimating expected incentive. o Gives AE greater flexibility on calling DR events. • Scheduled coaching sessions with existing and potential participants. • The program remains at 78% of the way to its MW goal due to COVID-19 and mandates to prevent its Water Heater Timers spread. Green Building Awards Outreach • Honored by HIVE 50 Innovation in Housing as "The Pioneer" • City of Austin honored by Green Builder Media as Sustainable City of the Year with …
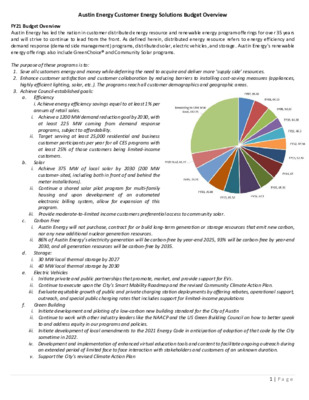
Austin Energy Customer Energy Solutions Budget Overview FY21 Budget Overview Austin Energy has led the nation in customer distributed energy resource and renewable energy program offerings for over 35 years and will strive to continue to lead from the front. As defined herein, distributed energy resource refers to energy efficiency and demand response (demand side management) programs, distributed solar, electric vehicles, and storage. Austin Energy’s renewable energy offerings also include GreenChoice® and Community Solar programs. The purpose of these programs is to: 1. Save all customers energy and money while deferring the need to acquire and deliver more ‘supply side’ resources. 2. Enhance customer satisfaction and customer collaboration by reducing barriers to installing cost-saving measures (appliances, highly efficient lighting, solar, etc.). The programs reach all customer demographics and geographic areas. 3. Achieve Council-established goals: Efficiency i. Achieve energy efficiency savings equal to at least 1% per annum of retail sales. i. Achieve a 1200 MW demand reduction goal by 2030, with least 225 MW coming from demand response at programs, subject to affordability. ii. Target serving at least 25,000 residential and business customer participants per year for all CES programs with at least 25% of those customers being limited-income customers. Solar i. Achieve 375 MW of local solar by 2030 (200 MW customer-sited, including both in front of and behind the meter installations). ii. Continue a shared solar pilot program for multi-family housing and upon development of an automated electronic billing system, allow for expansion of this program. a. b. d. e. iii. Provide moderate-to-limited income customers preferential access to community solar. c. Carbon Free i. Austin Energy will not purchase, contract for or build long-term generation or storage resources that emit new carbon, nor any new additional nuclear generation resources. ii. 86% of Austin Energy’s electricity generation will be carbon-free by year-end 2025, 93% will be carbon-free by year-end 2030, and all generation resources will be carbon-free by 2035. Storage: i. 30 MW local thermal storage by 2027 ii. 40 MW local thermal storage by 2030 Initiate private and public partnerships that promote, market, and provide support for EVs. Electric Vehicles i. ii. Continue to execute upon the City's Smart Mobility Roadmap and the revised Community Climate Action Plan. iii. Evaluate equitable growth of public and private charging station deployments by offering rebates, operational support, outreach, and special public charging rates that includes support for limited-income populations f. Green …
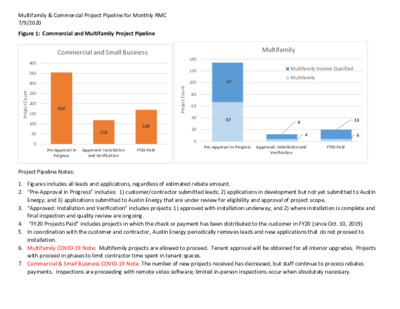
Multifamily & Commercial Project Pipeline for Monthly RMC 7/9/2020 Figure 1: Commercial and Multifamily Project Pipeline Commercial and Small Business Multifamily t n u o C t c e o r P j 400 350 300 250 200 150 100 50 0 Multifamily Income Qualified Multifamily t n u o C t c e o r P j 140 120 100 80 60 40 20 0 67 67 354 118 169 Pre-Approval in Approved: Installation FY20 Paid Progress and Verification Project Pipeline Notes: Pre-Approval in Progress Approved: Installation and FY20 Paid Verification 8 4 16 4 1. Figures includes all leads and applications, regardless of estimated rebate amount. 2. “Pre-Approval in Progress” includes: 1) customer/contractor submitted leads; 2) applications in development but not yet submitted to Austin Energy; and 3) applications submitted to Austin Energy that are under review for eligibility and approval of project scope. 3. “Approved: Installation and Verification” includes projects: 1) approved with installation underway; and 2) where installation is complete and final inspection and quality review are ongoing. 4. “FY20 Projects Paid” includes projects in which the check or payment has been distributed to the customer in FY20 (since Oct. 10, 2019) 5. In coordination with the customer and contractor, Austin Energy periodically removes leads and new applications that do not proceed to 6. Multifamily COVID-19 Note: Multifamily projects are allowed to proceed. Tenant approval will be obtained for all interior upgrades. Projects with proceed in phases to limit contractor time spent in tenant spaces. 7. Commercial & Small Business COVID-19 Note: The number of new projects received has decreased, but staff continue to process rebates payments. Inspections are proceeding with remote video software; limited in-person inspections occur when absolutely necessary. Installation. Multifamily & Commercial Project Pipeline for Monthly RMC 7/9/2020 Table 1: Multifamily and Multifamily Income Qualified – Estimated RCA Project Pipeline (for estimated rebates >$61k) Program Latest Enrollment Location Workflow # Name Installation Address Council District Estimated Estimated kW w TDS kWh w TDS Estimated $ Incentive Multifamily 1184360 Installation On Hold Iron Horse Flats* 1930 W RUNDBERG LN 4 58.4 204,004 $95,630 Total # of Units 200 Measures Planned Lighting, Smart Thermostats, HVAC Tune-Up (installation on hold) Phase 1: Solar Screens (completed) Phase 2: HVAC Tune-Up, Smart Thermostats, and lighting (in- progress) Phase 3: Plenum Redesign and Remediation (planned) Multifamily Income Qualified Installation Bridge At Northwest Hills* 3600 GREYSTONE DR 1190789 (Phase 1) …
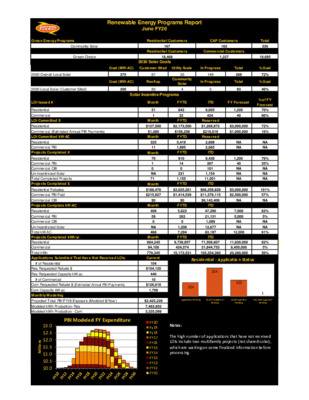
Total33019,695Goal (MW-AC)Customer-SitedUtility Scale In ProgressTotal% Goal2030 Overall Local Solar375873314926972%Goal (MW-AC)RooftopCommunity SolarIn ProgressTotal% Goal2030 Local Solar (Customer Sited)20083459346%MonthFYTDITDFY Forecast% of FY Forecast518439,6051,20070%1324344080%MonthFYTDReserved$127,500$2,173,500$1,269,972$3,000,00072%$1,080$156,208$216,019$1,000,00016%MonthFYTDReserved3255,4192,699NANA111,8952,665NANAMonthFYTDITD709109,4391,20076%1143074035%00101NANANA2311,154NANA711,15511,001NANAMonthFYTDITD$186,476$3,025,261$66,358,828$3,000,000101%$215,927$1,414,539$11,379,115$2,500,00057%$0$0$6,143,408NANAMonthFYTDITD4095,82347,2907,00083%5926321,1315,0005%001,099NANANA1,20813,677NANA4687,29483,19712,00061%Projects Completed kWh/yr.MonthFYTDITD684,2459,738,95771,509,60711,830,00082%94,100434,57431,844,7538,450,0005%778,34510,173,531103,354,36020,280,00050%CurrentITD104$104,12044010NANANANA$126,618NANANANA1,799NANANANANANANANA$2,425,228NANANANA7,463,852NANANANA3,335,099NANANANASolar Incentive Programs18,468163Residential Customers1,227Commercial CustomersGreen Energy ProgramsCommunity SolarGreen Choice2030 Solar GoalsRenewable Energy Programs ReportJune FY20CAP Customers167Residential CustomersLOI Issued #Residential RebatesCommercial PBI Paid Commercial CBIProjects Completed $LOI Committed kW-ACLOI Committed $ Commercial CBIUn-Incentivized SolarTotal Completed ProjectsResidential Commercial ResidentialCommercial PBICommercial (Estimated Annual PBI Payments)ResidentialModeled kWh Production- Res Modeled kWh Production - Com Monthly ModelingRes Requested Rebate $Res Requested Capacity kW-ac # of Commercial Com Requested Rebate $ (Estimated Annual PBI Payments)Commercial PBIProjects Completed #Residential Com Capacity kW-acProjected Total PBI FY18 Exposure (Modeled $/Year)Applications Submitted That Have Not Received LOIsTotal kW ACResidential Commercial Total kWh # of Residential Residential Commercial PBIProjects Complete kW-ACCommercial CBIUn-Incentivized Solar1042141221Application PendingWork CompletionPendingFinal InspectionPendingPayment ApprovalPendingResidential -Application Status$0.0$0.5$1.0$1.5$2.0$2.5$3.0MillionsPBI Modeled FY ExpenditureFY20Fy19Fy18FY17FY16FY15FY14FY13FY12FY11FY10Notes:Thehigh number of applications that have not received LOIs include two multifamily projects (not shared solar), which are waiting on some finalized information before processing.
RESOURCE MANAGEMENT COMMISSION MEETING MINUTES Wednesday July 22, 2020 The Resource Management Commission convened via videoconference on Wednesday, July 22nd, 2020 in accordance with social distancing protocols necessitated by the Covid 19 pandemic. Commissioners in Attendance: Dana Harmon, Chair (District 9); Kaiba White, Vice Chair (District 2); Leo Dielmann (District 7); Jonathan Blackburn (District 8); Rebecca Brenneman (District 10); Lisa Chavarria (Mayor); James Babyak (District 6); Shane Johnson (District 4) and Tom “Smitty” Smith (District 5). There is one vacancy (District 3). Commissioners Absent: Nakyshia Fralin (District 1); CALL TO ORDER – Chair Harmon called the meeting to order at 3:04 p.m. Consent Items: APPROVAL OF MINUTES 1. Approve minutes of the June 17t , 2020 meeting. The motion to approve minutes of the June 17th, 2020 meeting with corrections was approved on a Commissioner Dielmann motion, Commissioner Johnson second on a vote of 8 ayes, 0 nays, 1 abstention (Babyak) ,1 absent, 1 vacancy. STAFF REPORTS AND BRIEFINGS 2. .Briefing and presentation by from the city of Austin Equity Office. Josh. Robinson, Commissions Liaison, City of Austin Equity Office, gave a presentation on equity and inclusion in Austin. After which, the Commissioners discussed how to increase equity and inclusion in their work including the scheduling of a workshop and a request to staff to investigate the feasibility of holding meetings in various locations throughout the City. Immediately upon completion of the presentation, the Commission took up Item 4 which is discussed below. 3. Presentation of 2021 Austin Energy Customer Energy Solutions Budget. Debbie Kimberly, Vice President of Customer Energy Solutions for Austin Energy provided an overview of the upcoming budget for energy efficiency, solar, and other customer programs as well as a discussion of achievements from the previous year. Mrs. Kimberly also discussed the affect the COVID 19 pandemic has had on certain programs which require extensive in-home contact with customers. NEW BUSINESS 4. Discussion and possible action on increasing equity and inclusion though a workshop of commissioners and developing processes to increase equity and inclusion within the Commission. The Commission voted unanimously to establish a workshop of the Commission with the City of Austin Equity Office on racial equity and inclusion. 9 ayes, 1 absent (Fraylin). 5. Establish a working group of Resource Management Commissioners to coordinate with the Office of Sustainability regarding the Austin Community Emissions Dashboard as it relates to Commission goals. This item was not …
Resource Management Commission Equity Intro Workshop 1 Introduction and Ice-Breaker Why does Resource Management Commission exist? What role do you play in this commission, your mission, the goals/outcomes you want to achieve? 2 All men are created equal... ...was revolutionary at the time, but when Jefferson spoke these words, they applied to White male property owners. 3 Of the people, by the people, and for the people... ...yet our leaders across all industries don’t come close to the diversity of our communities. Women didn’t get the right to vote until 1920. Until the Voting Rights Act of 1965 People of Color were guaranteed access to their vote 4 Who we are: Racial equity is the condition when race no longer predicts a person’s quality of life outcomes in our community. The City recognizes that race is the primary determinant of social equity and therefore we begin the journey toward social equity with this definition. The City of Austin recognizes historical and structural disparities and a need for alleviation of these wrongs by critically transforming its institutions and creating a culture of equity. Often confused… ...But NOT the same 5 Our framework for Equity: Equity Lens 6 Map of Poverty: 7 Who Pollutes, Who is Impacted? A study published in the Academy of the Sciences in 2019 found that although White Americans are the majority polluters, it is Black and Latinx people who are impacted This increases risk of cardiovascular problems, respiratory illness, diabetes and even birth defects 8 An Example of “Colorblindness” Replicated Study done by Southampton University 19,000 emails to public service departments including Libraries, Schools, Sheriffs, County Treasurers and Clerk’s Offices Identical email requests apart from names. Black sounding names were both: •less likely to receive a response •less likely to have a cordial, respectful response Susan Smith LaKesha Washington Source: Racial Discrimination in Local Public Services: A Field Experiment in the US 9 What would equitable recommendations look like from the Resource Management Commission 10 Thank you! Any questions? 11
Annual Internal Review This report covers the time period of 7/1/2019 to 6/30/2020 RESOURCE MANAGEMENT COMMISSION The Resource Management Commission’s mission statement per the City Code is: (A) Maintain an overview of all programs, studies and proposals concerning the efficient use of energy, alternate energy technologies, renewable energy resources, including solar and wind, and the conservation of energy, excluding the use of conventional coal, nuclear, natural gas, or petroleum technologies. (B) Serve as a liaison with other city commissions, including the Electric Utility Commission. (C) Receive citizen input on alternate energy technologies, renewable energy sources, and on energy conservation. (D) Review and analyze: (1) energy conservation technologies and renewable energy sources as to their short-term and (2) energy conservation policies, alternate energy technologies, and renewable energy projects in (3) water conservation policies, alternate technologies, and water conservation projects in other long-term feasibility in the city; other cities and states; cities and states; and (4) City Code to identify potential amendments that encourage the use of alternate energy technologies and renewable energy sources, and the conservation of energy. (E) Advise the City Council: (1) in developing and reviewing city plans and programs in the area of alternate energy technologies, renewable energy sources, and energy conservation. (2) as to available funding from private and public sources which are available to the city for alternate energy technologies and renewable energy, and for the conservation of energy; (3) on energy conservation, on alternate energy technologies, and on renewable energy sources and report to City Council on the status of its activities at least annually; (4) in developing and reviewing city plans and programs that encourage water conservation as it relates to water consumption from the tap to customer and within structures or building; and, (5) regarding appropriate City Code amendments that encourage the use of alternate energy technologies and renewable energy sources, and the conservation of energy. (1) the conservation of energy, the use of alternate energy technologies and renewable energy sources in City-owned facilities; and Page 1 of 4 (F) Encourage: Resource Management Commission Annual Internal Review Report 2019-2020 (2) the private and public sectors to develop and to use alternate energy technologies and renewable energy sources, and to conserve energy. 1. Describe the board’s actions supporting their mission during the previous calendar year. Address all elements of the board’s mission statement as provided in the relevant sections of the City Code. The …