FY20 Austin Energy Customer Energy Solutions Savings Report — original pdf
Backup
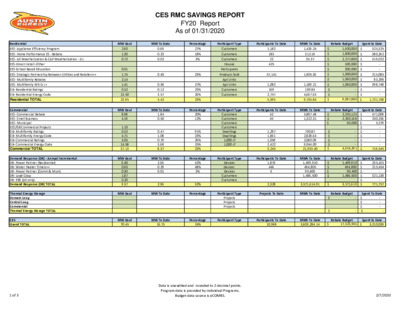
CES RMC SAVINGS REPORT FY20 Report As of 01/31/2020 MW Goal MW To Date Percentage Participant Type Participants To Date MWh To Date Rebate Budget MW Goal MW To Date Percentage Participant Type Participants To Date MWh To Date Rebate Budget Residential EES- Appliance Efficiency Program EES- Home Performance ES - Rebate EES- AE Weatherization & CAP Weatherization - D.I. EES-Direct Install -Other EES-School Based Education EES- Strategic Partnership Between Utilities and Retailers++ EES- Multifamily Rebates EES- Multifamily WX-D.I.+ GB- Residential Ratings GB- Residential Energy Code Residential TOTAL Commercial EES- Commercial Rebate EES- Small Business EES- Municipal EES/GB Commercial Projects GB- Multifamily Ratings GB- Multifamily Energy Code GB- Commercial Ratings GB- Commercial Energy Code Commercial TOTAL Demand Response (DR) - Annual Incremental DR- Power Partner (Residential) DR- Water Heater Timers++ DR- Power Partner (Comm & Muni) DR- Load Coop DR- ERS (AE only) Demand Response (DR) TOTAL Thermal Energy Storage Domain Loop Central Loop Commercial Thermal Energy Storage TOTAL CES Grand TOTAL 2.60 1.30 0.72 0.01 1.75 2.14 1.41 0.52 13.50 23.95 8.98 4.19 1.10 0.52 4.71 3.05 14.58 37.13 6.40 0.60 0.30 1.87 0.20 9.37 0.69 0.23 0.02 0.40 0.38 0.12 3.57 5.42 1.84 0.50 0.47 1.08 0.79 3.68 8.37 2.66 0.29 0.01 2.96 27% 18% 3% 23% 27% 23% 26% 23% 20% 12% 91% 23% 26% 25% 23% 42% 48% 3% 32% Customers Customers Customers Houses Participants Products Sold Apt Units Apt Units Customers Customers Customers Customers Customers Customers Dwellings Dwellings 1,000 sf 1,000 sf Devices Devices Devices Customers Customers Projects Projects Projects 1,182 183 22 425 57,141 1,082 169 2,757 5,395 42 45 1,297 1,861 1,059 2,422 3,245 1,876 446 6 2,328 1,426.24 312.19 35.37 1,905.36 1,189.21 199.84 4,667.63 9,735.84 5,887.48 1,322.31 790.87 2,828.64 2,060.09 9,044.00 21,933.40 $ 1,600,000 $ 1,800,000 $ 2,277,000 $ 100,000 $ 200,000 $ 1,000,000 $ 1,060,000 $ 1,060,000 $ - $ - $ 9,097,000 $ 2,335,123 $ 2,260,168 $ 60,000 $ - $ - $ - $ - $ 4,655,291 1,499,910 494,805 90,400 1,486,500 $ 1,499,910 $ 494,800 $ 90,400 $ 1,486,500 3,571,614.91 $ 3,571,610 325,325 380,262 319,022 Spent to Date $ $ $ $ - - $ $ $ $ - $ $ - $ 215,085 83,298 398,748 1,721,738 471,009 240,256 5,279 Spent to Date $ $ $ - $ $ - $ - $ - - $ $ 716,545 235,165 215,454 Spent to Date $ $ $ - $ - $ $ 771,757 321,138 $ - $ - Spent To Date - $ $ - $ - $ - MW Goal MW To Date Percentage Participant Type Projects To Date MWh To Date Rebate Budget MW Goal 70.45 MW To Date 16.75 24% Percentage Participant Type Participants To Date 10,968 MWh To Date 3,603,284.14 Rebate Budget Spent to Date $ 17,323,901 $ 3,210,039 MW Goal MW To Date Percentage Participant Type Participants To Date MWh To Date Rebate Budget 1 of 3 2/7/2020 Data is unaudited and rounded to 2 decimal points. Program data is provided by individual Programs. Budget data source is eCOMBS. CES RMC SAVINGS REPORT FY20 Report As of 01/31/2020 Solar Energy Residential Commercial Solar Energy TOTAL Low Income Energy Efficiency Programs Solar Green Building MW Goal MW To Date Percentage Participant Type Participants To Date MWh To Date 7.00 5.00 12.00 2.83 0.10 2.93 40% 2% 24% Customers Customers 452 1 453 4734.40 161.82 4,896.23 Incentive Budgetǂ $ 3,000,000 $ 2,500,000 $ 5,500,000 Spent to Date $ $ $ 1,510,138 605,238 2,115,376 UPDATE In January, 35 of 42 Single Family homes receiving an AE Green Building rating are in SMART Housing developments in the AE service area. Two Multifamily SMART housing developments with a total of 79 units received a 3-star rating and a third Multifamily SMART housing development with 70 units received a 1-star rating. EES - LOAD COOP PROGRAM No. of Events No. of Applicants Participants /Locations Program Capacity MW Maximum Event Performance MW 2Applicants and locations modified as a result of non performance and failure to activate contracts by end of fiscal year. 3Program Capacity is the sum of all participants' best 2018 Load Coop performance or expected maximum drop based on audit information. Includes T&D&SR. 4Best performance for any one event including 20% T&D&SR multiplier. DR Capacity Program Cycle Saver* Free Thermostat** Power Partner Thermostat Emergency Response System (AE only) EES Behavioral Programs PSV Newsletter & Outreach Residential App Commercial App Electric Vehicle Programs Commercial Charging Stations Residential Charging Stations E-Ride Devices/ Participants 21,962 11,384 33,178 - Units Participants Participants Participants Program Capacity (MW) 14.280 11.04* 47.11 0.20 Count 84 32,041 3,161 Rebates Spent To Date 8 101 145 $ $ $ 70,000 67,701 45,400 Loan Program EES- Home Performance ES-Loan* *The rebate loan program is used to provide Velocity loans with a reduced interest rate for customers who perform energy efficiency improvements (with approved credit). Program Spend - $ $ 200,000 Customers 40 Budget Includes cleared payments and pending payments. *Currently maintaining existing population of Cycle Saver water heater timers through replacement of units at 10 years. **Numbers based on M&V study summer of 2018. 2 of 3 2/7/2020 Data is unaudited and rounded to 2 decimal points. Program data is provided by individual Programs. Budget data source is eCOMBS. CES RMC SAVINGS REPORT FY20 Report As of 01/31/2020 Green Building Impacts Credited to Solar Energy Credited to Thermal Energy Storage Credited to Solar Energy Natural gas Building water Irrigation water Construction Waste diversion Units MW MW MWh CCF 1,000 gal 1,000 gal Tons Saved 0.09 64,925.00 14,453.00 14,714.00 16,264.00 EES/GB Water Savings Gallons/yr. at 0.45 Gallon/kWh 1,621,477,864 Avoided power plant water consumption (evaporation only). NOTES Above expenditures may include encumbrances. SPUR savings numbers are now audited for the previous month. Therefore, they are reported with a one month delay. Money spent on the DR-Cycle Saver program is funded from the DR Power Partner (Residential) Rebate Budget. Total commercial participation does not include GB commercial square foot. Thermal Energy Storage Budget is not part of Customer Energy Solutions Budget. *Currently maintaining existing population of Cycle Saver water heater timers through replacement of units at 10 years. **Numbers based on M&V study summer of 2016. Free thermostats were not adjusted in FY18 for attrition. ++Budgets maintained within other programs and tracked outside of eCOMBS. Goals and savings are calculated to included T&D line losses and spinning reserves. The ERS MW total is based on contracted and ERCOT-tested capacity. ERS now only reports incremental MW increases. ǂ Budget for Residential Solar includes incentives only Energy code savings from building permits are reported in the corresponding month one year post permit, thus Energy code savings from FY2019 building permits are reported in FY2020. 3 of 3 2/7/2020 Data is unaudited and rounded to 2 decimal points. Program data is provided by individual Programs. Budget data source is eCOMBS.