MEMBERS: RESOURCE MANAGEMENT COMMISSION FEBRUARY 18, 2020 6:30 PM TOWN LAKE CENTER – SHUDDE FATH CONFERENCE ROOM 721 BARTON SPRINGS ROAD, AUSTIN, TEXAS Leo Dielmann, Chair (District 7) Kaiba White, Vice Chair (District 2) James Babyak (District 6) Jonathan Blackburn (District 8) Rebecca Brenneman (District 10) Lisa Chavarria (Mayor) Nakyshia Fralin (District 1) Dana Harmon (District 9) Shane Johnson (District 4) Tom “Smitty” Smith (District 5) Vacant (District 3) AGENDA CALL TO ORDER CITIZEN COMMUNICATION: GENERAL Speakers signed up prior to the meeting being called to order will each be allowed three minutes to address concerns regarding items not posted on the agenda. APPROVAL OF MINUTES 1. Approve minutes of the January 21, 2020 meeting. NEW BUSINESS 2. Discussion with Texas Gas Service regarding rebates for new construction. STAFF REPORTS AND BRIEFINGS 3. Update on the City’s review of the Texas Gas Service Energy Efficiency/Conservation program. (Rondella Hawkins, Telecommunications & Regulatory Affairs Officer) UPDATES FROM COMMISSIONERS, WORKING GROUPS 4. Update from members of the EUC Resource Planning Working Group: Commissioners Dielmann and White 5. Update from members of the Resource Management Commission Access to Solar Working Group: Commissioners Brenneman, Harmon and Johnson and White OTHER BUSINESS 6. Revise the 2020 RMC meeting schedule to cancel the March 10, 2020 Regular Meeting and set a Special Called Joint Meeting with the Electric Utility Commission for March 9, 2020 for briefing, discussion and possible action on the Resource Plan FUTURE AGENDA ITEMS 7. Discuss potential future agenda items. ADJOURN The City of Austin is committed to compliance with the American with Disabilities Act. Reasonable modifications and equal access to communications will be provided upon request. Meeting locations are planned with wheelchair access. If requiring Sign Language Interpreters or alternative formats, please call (512) 322-6450 at least 48 hours before the meeting date. TTY users route through Relay Texas at 711. For more information, please call (512) 322-6505.
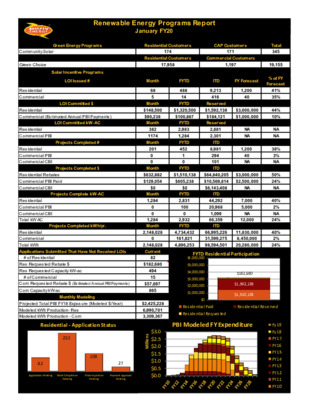
Renewable Energy Programs Report January FY20 Green Energy Programs Residential Customers CAP Customers Residential Customers Commercial Customers 174 17,958 171 1,197 ITD FY Forecast Total 345 19,155 % of FY Forecast Residential Commercial (Estimated Annual PBI Payments) $148,500 $1,320,500 $1,592,138 $3,000,000 $100,867 $1,000,000 Solar Incentive Programs LOI Issued # LOI Committed $ LOI Committed kW-AC Projects Completed # Projects Completed $ Projects Complete kW-AC Community Solar Green Choice Residential Commercial Residential Commercial PBI Residential Commercial PBI Commercial CBI Residential Rebates Commercial PBI Paid Commercial CBI Residential Commercial PBI Commercial CBI Total kW AC Residential Commercial Total kWh Projects Completed kWh/yr. Applications Submitted That Have Not Received LOIs # of Residential Res Requested Rebate $ Res Requested Capacity kW-ac # of Commercial Com Requested Rebate $ (Estimated Annual PBI Payments) Com Capacity kW-ac Monthly Modeling Projected Total PBI FY18 Exposure (Modeled $/Year) Modeled kWh Production- Res Modeled kWh Production - Com $2,425,228 6,990,701 3,309,367 Residential - Application Status 232 82 108 27 Application Pending Work Completion Final Ins pection Payment Approval Pending Pending Pending Month 68 5 Month $90,238 Month 382 1174 Month 201 0 0 Month $632,882 $129,054 $0 Month 1,284 0 0 0 1,284 Month 2,148,028 2,148,028 Current $182,680 82 494 15 865 $57,697 s n o i l l i M $3.0 $2.5 $2.0 $1.5 $1.0 $0.5 $0.0 FYTD 488 14 FYTD FYTD 2,983 1,284 FYTD 452 1 0 $0 FYTD 2,831 100 0 2,932 FYTD 9,213 416 Reserved $184,121 Reserved 2,881 2,301 ITD 8,981 294 101 ITD ITD 44,292 20,968 1,099 66,359 ITD 1,200 40 NA NA 1,200 40 NA 7,000 5,000 NA 12,000 FYTD $1,510,138 $605,238 $64,840,205 $10,569,814 $6,143,408 $3,000,000 $2,500,000 NA 4,734,432 161,821 4,896,253 66,995,226 31,599,275 98,594,501 11,830,000 8,450,000 20,280,000 FYTD Residential Participation ITD $6,000,000 $5,000,000 $4,000,000 $3,000,000 $2,000,000 NA NA NA NA $182,680 NA NA $1,592,138 $0 $1,000,000 $1,510,138 NA NA NA Residential Paid NA Residential Requested NA NA NA NA NA NA PBI Modeled FY Expenditure NA NA NA Residential Reserved NA NA NA NA NA NA NA 41% 35% 44% 10% NA NA 38% 3% NA 50% 24% NA 40% 2% NA 24% 40% 2% 24% NA NA Fy19 Fy18 FY17 FY16 FY15 FY14 FY13 FY12 FY11 FY10
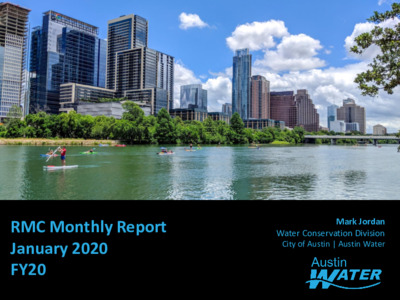
RMC Monthly Report January 2020 FY20 Mark Jordan Water Conservation Division City of Austin | Austin Water Residential Program Participation FY17 FY18 FY19 FY20 s t i n U f o r e b m u N 700 600 500 400 300 200 100 0 242 249 200 163 353 207 20 16 19 10 14 12 1 8 19 10 8 2 5 1 54 47 31 114 92 91 121 26 Irrigation Audits Pressure Reduction Watering Timer Irrigation Upgrade Valve WaterWise Landscape Landscape Survival Tools Rainwater Harvesting RMC Monthly Report – January 2020, FY20 02 60 50 40 s t i n U f o r e b m u N 30 20 10 0 Commercial & Multifamily Program Participation FY17 FY18 FY19 FY20 51 17 8 3 2 0 4 0 1 1 0 0 1 0 0 0 0 Commercial Process Commercial Audit Irrigation Efficiency WaterWise Landscape PRV Rebate RMC Monthly Report – January 2020, FY20 03 $450,000 $400,000 $350,000 $300,000 $ e v i t n e c n I $ $250,000 $200,000 $150,000 $100,000 $50,000 $0 Rebates and Incentives Budget, FY20 YTD FY20 Total Budget Q1 Q2 Q3 Q4 $420,000 $245,000 $47,360.00 $65,000 $- $19,394.94 Commercial Commercial Multi-Family Multi-Family Residential Residential RMC Monthly Report – January 2020, FY20 04 180 160 140 120 100 80 60 40 20 0 FY20 YTD Water Waste Enforcement Activity Warnings and 311 Reports 162 72 71 59 63 Oct 4 Nov 2 Dec Warnings 311 Reports 8 Jan RMC Monthly Report – January 2020, FY20 05 FY20 YTD Water Waste Enforcement Activity Administrative Fines Residential Commercial Multi-Family • 16 properties fined • 0 appeals filed • 0 appeals overturned s e i t r e p o r P f o r e b m u N 6 5 4 3 2 1 0 1st Fine 2nd Fine 3rd Fine 4th Fine RMC Monthly Report – January 2020, FY20 06 Public Outreach Activity Number of Events FY19 FY20 Populations Reached FY19 FY20 76 24,073 80 70 60 50 40 30 20 10 0 48 13 25,000 20,000 15,000 5,000 0 29 10,000 12,825 5,282 Community Events School Presentations 553 Community Events School Presentations RMC Monthly Report – January 2020, FY20 07 Social Media Activity, FY20 YTD Oct Nov Dec Sep 88,700 81,200 55,900 s n o i t c a r e t n I f o r …
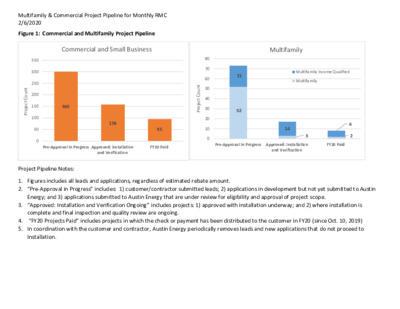
Multifamily & Commercial Project Pipeline for Monthly RMC 2/6/2020 Figure 1: Commercial and Multifamily Project Pipeline Commercial and Small Business Multifamily t n u o C t c e o r P j 350 300 250 200 150 100 50 0 300 158 95 Pre-Approval in Progress Approved: Installation FY20 Paid and Verification Project Pipeline Notes: 21 52 t n u o C t c e o r P j 80 70 60 50 40 30 20 10 0 Multifamily Income Qualified Multifamily Pre-Approval in Progress Approved: Installation FY20 Paid 14 3 and Verification 6 2 1. Figures includes all leads and applications, regardless of estimated rebate amount. 2. “Pre-Approval in Progress” includes: 1) customer/contractor submitted leads; 2) applications in development but not yet submitted to Austin Energy; and 3) applications submitted to Austin Energy that are under review for eligibility and approval of project scope. 3. “Approved: Installation and Verification Ongoing” includes projects: 1) approved with installation underway; and 2) where installation is complete and final inspection and quality review are ongoing. 4. “FY20 Projects Paid” includes projects in which the check or payment has been distributed to the customer in FY20 (since Oct. 10, 2019) 5. In coordination with the customer and contractor, Austin Energy periodically removes leads and new applications that do not proceed to Installation. Multifamily & Commercial Project Pipeline for Monthly RMC 2/6/2020 Table 1: Multifamily and Multifamily Income Qualified – Estimated RCA Project Pipeline (for estimated rebates >$61k) Program Latest Enrollment Workflow Number Location Name Installation Address Council District Estimated Estimated kW w TDS kWh w TDS Estimated $ Incentive Measures Planned Total # of Units Multifamily Installation 1184360 58.4 204,004 $95,630 Iron Horse Flats* 1930 W RUNDBERG LN MF Income Qualified Post- Installation QA Review 1179433 Forest Park Apartments* 1088 PARK PLZ 97.8 413,997 $157,879 MF Income Qualified Payment Issued 1177101 Silver Springs Apartments* 12151 N IH 35 SVRD NB 266.2 859,520 $246,290 Table 2: Commercial and Small Business – Estimated RCA Project Pipeline (for estimated rebates >$61k) 4 4 1 Lighting, Smart Thermostats, HVAC Tune- Up, Attic Insulation, Duct Sealing, Lighting, Smart Thermostats, HVAC Tune- Up, Water Saving Devices Duct Sealing, Lighting, Smart Thermostats, HVAC Tune-Up, Water Saving Devices 200 228 360 Program Latest Workflow Enrollment Number Location Name Installation Address Commercial Installation 1090681 Seton Healthcare* 1201 W 38TH ST Council District Estimated kW w TDS 10 10 571 220 Estimated kWh …
RESOURCE MANAGEMENT COMMISSION MEETING MINUTES TUESDAY, FEBRUARY 18, 2020 The Resource Management Commission convened a meeting on Tuesday, January 18th, 2020 at Town Lake Center, 721 Barton Springs Road, in Austin, Texas. Commissioners in Attendance: Kaiba White, Vice Chair (District 2); Jonathan Blackburn (District 8); Dana Harmon (District 9); Shane Johnson (District 4).); Rebecca Brenneman (District 10); Lisa Chavarria (Mayor); and Tom “Smitty” Smith (District 5). Commissioners Absent: James Babyak (District 6); Nakyshia Fralin (District 1); Leo Dielmann, Chair (District 7); There is one vacancy (District 3). Staff in Attendance: Hayley Cunningham and Larry Graham of Texas Gas Service; Jamie Mitchell of Austin Energy. CALL TO ORDER – Vice Chair White called the meeting to order at 6:50 p.m. CITIZEN COMMUNICATION: GENERAL Paul Robbins discussed Green Buiding Standards Revisions. Mr. Robbins also offered to provide a twenty minute presentation on this subject. . Consent Items: APPROVAL OF MINUTES 1. Approve minutes of the January 21, 2020 meeting. The motion to approve minutes of the January 21, 2020 meeting was approved on Commissioner Smith’s motion, Commissioner Harmon’s second, on a 6-0 vote, with Commissioner Brenneman abstaining. Chair Dielmann and Commissioners Babyak, Fralin absent. NEW BUSINESS 2. Discussion with Texas Gas Service regarding rebates for new construction Larry Graham with Texas Gas Service discussed natural gas use in Austin, Texas Gas Service’s studies on using alternative sources such as methane from water treatment plants and consumer preferences being met by builders homes. Mr. Graham also providied information on upcoming rate case of Texas Natural Gas Non-Consent STAFF REPORTS AND BRIEFINGS 3. Update on the City’s review of the Texas Gas Service Energy Efficiency/Conservation program. (Rondella Hawkins, Telecommunications & Regulatory Affairs Officer) Citizen Communication: Paul Robbins discussed the proposed rate structure for Texas Natural Gas. Rondella Hawkins, the Telecommunicatins and Regulatory Affairs Officer for the City of Austin discussed the upcoming schedule for the rate case. Commisisoner Smith queried staff if the Resource Management Commission or the Electric Utility Commission has purview over rates. Staff responded that they did not. UPDATES FROM COMMISSIONERS, WORKING GROUP 4. Update from members of the EUC Resource Planning Working Group: Commissioners Dielmann and White Commissioner White provided an update on the EUC Resource Planning Working Group plan, process, and progress to date. Commissioners discussed the role of Austin Energy programs in the resource planning process, the role of storage and resource planning in future …