RMC Monthly Report June 2021 FY21 Water Conservation Division City of Austin | Austin Water s t i n U f o r e b m u N 700 600 500 400 300 200 100 0 Residential Program Participation, FYTD FY18 FY19 FY20 FY21 353 121 122 126 223 249 253 200 134 114 91 69 55 23 54 31 26 20 19 8 6 8 2 2 5 5 Home Water Use Monitoring Device Irrigation Upgrade Irrigation Audits Drought Survival Tools WaterWise Landscape WaterWise Rainscape Rainwater Harvesting RMC Monthly Report – June 2021, FY21 02 12000 10000 8000 s t i n U f o 6000 r e b m u N 4000 2000 0 Commercial & Multifamily Program Participation, FYTD FY18 FY19 FY20 FY21 10,000 8,200 1,500 5,000 03 3 2 54 2 2 0 11 0 2 1 1 0 1 0 0 0 Commercial Process Rebates Commercial Kitchen Rebates RWH Rebate (Non- Pressurized) RWH Rebate (Non- Pressurized Gallons) RWH Rebate (Pressurized) RWH Rebate (Pressurized Gallons) RMC Monthly Report – June 2021, FY21 $450,000 $400,000 $350,000 $300,000 $ e v i t n e c n I $250,000 $200,000 $150,000 $100,000 $50,000 $0 Rebates and Incentives Budget, FYTD FY21 Total Budget Q1 Q2 Q3 Q4 $420,000 $245,000 $110,694.30 $65,000 $14,053.25 $- Commercial Commercial Multi-Family Multi-Family Residential Residential RMC Monthly Report – June 2021, FY21 04 800 700 600 500 400 300 200 100 0 Water Waste/Watering Restrictions Enforcement Activity, FYTD Warnings Issued and 311 Reports 707 322 234 220 41 244 173 120 79 15 12 72 83 128 60 4 1 0 Oct Nov Dec Jan Feb Mar Apr May Jun Warnings 311 Reports Current Drought Response Stage: Conservation Stage RMC Monthly Report – June 2021, FY21 05 Regulated Compliance Program Activity, April 3124 3500 3000 2500 2000 1500 1000 500 0 177 181 26 232 61 Commercial Facility Irrigation Assessments Commercial Vehicle Wash Facility Efficiency Assessment Cooling Tower Efficiency Assessments Compliant Non-Compliant RMC Monthly Report – June 2021, FY21 06 Total Public Outreach Activity, FYTD Number of Events FY20 FY21 45 Populations Reached FY20 FY21 50 45 40 35 30 25 20 15 10 5 0 22 25,000 20,000 15,000 10,000 5,000 0 8,575 2 0 1,722 1,560 0 Community Events School Presentations Community Events School Presentations RMC Monthly Report – June 2021, FY21 07 Total Social Media Activity, FYTD Oct Nov Dec Jan Feb …
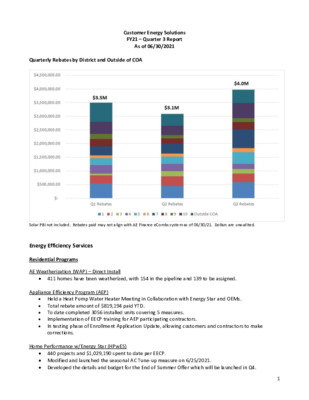
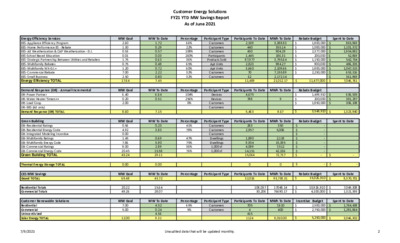
Customer Energy Solutions FY21 – Quarter 3 Report As of 06/30/2021 Quarterly Rebates by District and Outside of COA Solar PBI not included. Rebates paid may not align with AE Finance eCombs system as of 06/30/21. Dollars are unaudited. Energy Efficiency Services Residential Programs • 411 homes have been weatherized, with 154 in the pipeline and 139 to be assigned. AE Weatherization (WAP) – Direct Install Appliance Efficiency Program (AEP) • Held a Heat Pump Water Heater Meeting in Collaboration with Energy Star and OEMs. • Total rebate amount of $819,194 paid YTD. • To date completed 3056 installed units covering 5 measures. • • Implementation of EECP training for AEP participating contractors. In testing phase of Enrollment Application Update, allowing customers and contractors to make corrections. Home Performance w/Energy Star (HPwES) • 440 projects and $1,029,190 spent to date per EECP. • Modified and launched the seasonal AC Tune-up measure on 6/25/2021. • Developed the details and budget for the End of Summer Offer which will be launched in Q4. 1 SPUR – Instant Savings • Instant Savings has recently introduced electric lawn equipment to the product bundle and has had a fantastic customer response. These products include all electric lawn mowers, trimmers, leaf blowers and a combo trimmer/blower at The Home Depot. • • Recruited a new category of retailers to join Instant Savings in order to provide a new level of support to low income qualified customers. The retailers include Salvation Army, St, Vincent de Paul and Re- Habitat for Humanity. In the process of adding an environmental savings category to our report to CO2 emissions removed by pound per year. All-Stars • This school-based education program is not active in the summer however our 3rd party vendor (Blue Ocean Energy Mgmt.) is working on the completion of three video presentations to add additional support to the teachers during the experience. Multifamily Rebates & Multifamily Income Qualified Rebates Programs • 1,827 Total units completed • $636,151 Total incentives paid • Added summer bonus to Standard program and safety measures to Income Qualified • Piloting PTAC tune-up measure Commercial Programs Commercial and Small Business Rebates Program • Implemented a limited time bonus as a means to assist customers with capital requirements to allow them to reduce their overhead. • Revised HVAC and Chiller offerings to simplify the rebate structure in hopes to give customers better tools to make …
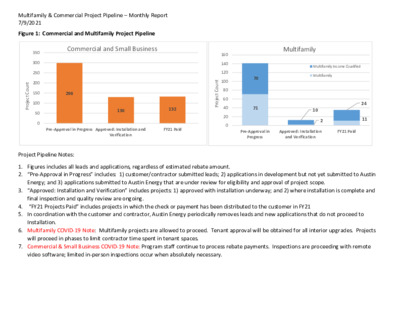
Multifamily & Commercial Project Pipeline – Monthly Report 7/9/2021 Figure 1: Commercial and Multifamily Project Pipeline Commercial and Small Business Multifamily 350 300 250 200 150 100 50 0 t n u o C t c e o r P j 160 140 120 100 80 60 40 20 0 t n u o C t c e o r P j 70 71 Multifamily Income Qualified Multifamily 10 2 24 11 298 130 132 Pre-Approval in Progress Approved: Installation and FY21 Paid Verification Pre-Approval in Progress Approved: Installation and Verification FY21 Paid Project Pipeline Notes: 1. Figures includes all leads and applications, regardless of estimated rebate amount. 2. “Pre-Approval in Progress” includes: 1) customer/contractor submitted leads; 2) applications in development but not yet submitted to Austin Energy; and 3) applications submitted to Austin Energy that are under review for eligibility and approval of project scope. 3. “Approved: Installation and Verification” includes projects: 1) approved with installation underway; and 2) where installation is complete and final inspection and quality review are ongoing. 4. “FY21 Projects Paid” includes projects in which the check or payment has been distributed to the customer in FY21 5. In coordination with the customer and contractor, Austin Energy periodically removes leads and new applications that do not proceed to Installation. 6. Multifamily COVID-19 Note: Multifamily projects are allowed to proceed. Tenant approval will be obtained for all interior upgrades. Projects will proceed in phases to limit contractor time spent in tenant spaces. 7. Commercial & Small Business COVID-19 Note: Program staff continue to process rebate payments. Inspections are proceeding with remote video software; limited in-person inspections occur when absolutely necessary. Multifamily & Commercial Project Pipeline – Monthly Report 7/9/2021 Table 1: Multifamily and Multifamily Income Qualified – Estimated RCA Project Pipeline (for estimated rebates >$62k) Program Latest Workflow Enrollment # Location Name Installation Address Council District Estimated kW savings Estimated kWh savings Estimated $ Incentive Paid 1213464 Bridge at Tech Ridge* 12800 CENTER LAKE DR 1 7 79.0 313,516 $154,191 Installation 1209470 Bridge at Terracina* 10 91.0 264,910 $153,023 Installation Trove Eastside* 3 216 593,241 $281,549 1231787, 1231196, 1231197 Multifamily Installation 1212346 8601 Anderson Mill 6 272 666,441 $231,549 Bexley Anderson Mill* Multifamily Income Qualified Multifamily Income Qualified Multifamily Income Qualified 8100 N. MoPac Expressway 2201 Montopolis Dr Multifamily Installation 1225046 Park Crestview* 8220 Research Blvd 7 248 514514 $241,049 * projects in which the RCA …
Versión en español a continuación. Resource Management Commission Meeting July 20, 2021 The Resource Management Commission to be held July 20, 2021 with Social Distancing Modifications Public comment will be allowed via telephone; no in-person input will be allowed. All speakers must register in advance of Monday, July 19, 2021 by noon. All public comment will occur at the beginning of the meeting. To speak remotely at the Resource Management Commission Meeting, members of the public must: •Call or email the board liaison at Natasha Goodwin at 512-322-6505 or Natasha.Goodwin@austinenergy.com no later than noon, Monday, July 19, 2021. The following information is required: speaker name, item number(s) they wish to speak on, whether they are for/against/neutral, email address and telephone number (must be the same number that will be used to call into the meeting). •Once a request to speak has been made to the board liaison, the information to call on the day of the scheduled meeting will be provided either by email or phone call. •Speakers must call in at least 15 minutes prior to meeting start time in order to speak, late callers will not be accepted and will not be able to speak. •Speakers will be placed in a queue until their time to speak. •Handouts or other information may be emailed to Natasha.Goodwin@austinenergy.com by noon the day before the scheduled meeting. This information will be provided to Board and Commission members in advance of the meeting. •If the meeting is broadcast live, it may be viewed here: http://www.austintexas.gov/page/watch-atxn-live T he City of Austin is committed to compliance with the American with Disabilities Act. Reasonable modifications and equal access to communications will be provided upon request. Meeting locations are planned with wheelchair access. If requiring Sign Language Interpreters or alternative formats, please call (512) 322-6450 at least 48 hours before the meeting date. T TY users route through Relay T exas at 711. For more information on the Resource Management Commission , please call Natasha Goodwin (512) 322-6505. Reunión del Resource Management Commission FECHA de la reunion (July 20, 2021) La junta se llevará con modificaciones de distanciamiento social Se permitirán comentarios públicos por teléfono; no se permitirá ninguna entrada en persona. Todos los oradores deben registrarse con anticipación (July 19, 2021). Todos los comentarios públicos se producirán al comienzo de la reunión. Para hablar de forma remota en la reunión, los miembros del público deben: …
Annual Internal Review This report covers the time period of 7/1/2020 to 6/30/2021 RESOURCE MANAGEMENT COMMISSION The Resource Management Commission’s mission statement per the City Code is: (A) Maintain an overview of all programs, studies and proposals concerning the efficient use of energy, alternate energy technologies, renewable energy resources, including solar and wind, and the conservation of energy, excluding the use of conventional coal, nuclear, natural gas, or petroleum technologies. (B) Serve as a liaison with other city commissions, including the Electric Utility (C) Receive citizen input on alternate energy technologies, renewable energy sources, Commission. and on energy conservation. (D) Review and analyze: (1) energy conservation technologies and renewable energy sources as to their short-term and long-term feasibility in the city; (2) energy conservation policies, alternate energy technologies, and renewable energy projects in other cities and states; (3) water conservation policies, alternate technologies, and water conservation projects in other cities and states; and (4) City Code to identify potential amendments that encourage the use of alternate energy technologies and renewable energy sources, and the conservation of energy. (E) Advise the City Council: (1) in developing and reviewing city plans and programs in the area of alternate energy technologies, renewable energy sources, and energy conservation. (2) as to available funding from private and public sources which are available to the city for alternate energy technologies and renewable energy, and for the conservation of energy; (3) on energy conservation, on alternate energy technologies, and on renewable energy sources and report to City Council on the status of its activities at least annually; (4) in developing and reviewing city plans and programs that encourage water conservation as it relates to water consumption from the tap to customer and within structures or building; and, 1 Resource Management Commission Annual Internal Review Report 2020-2021 (5) regarding appropriate City Code amendments that encourage the use of alternate energy technologies and renewable energy sources, and the conservation of energy. (F) Encourage: (1) the conservation of energy, the use of alternate energy technologies and renewable energy sources in City-owned facilities; and (2) the private and public sectors to develop and to use alternate energy technologies and renewable energy sources, and to conserve energy 1. Describe the board’s actions supporting their mission during the previous calendar year. Address all elements of the board’s mission statement as provided in the relevant sections of the City Code. The Resource Management Commission …