Item #2 Austin Fire Department Quarterly Report FY 25 Q2 Data — original pdf
Backup
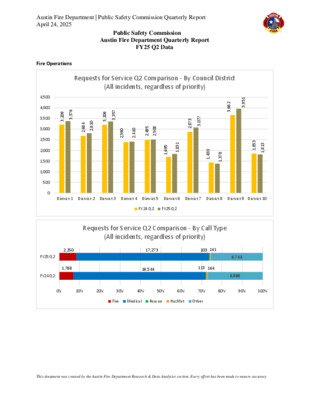
Austin Fire Department | Public Safety Commission Quarterly Report April 24, 2025 Public Safety Commission Austin Fire Department Quarterly Report FY25 Q2 Data Fire Operations Requests for Service Q2 Comparison - By Council District (All incidents, regardless of priority) 6 7 3 3 , 9 0 2 3 , 0 1 8 2 , 4 8 6 2 , 7 5 3 3 , 6 0 2 3 , 0 9 3 2 , 0 1 4 2 , 5 9 4 2 , 8 0 5 2 , 7 7 0 3 , 3 7 8 2 , 1 5 9 3 , 2 6 6 3 , 1 3 8 1 , 5 9 6 1 , 0 3 4 1 , 8 7 3 1 , 3 5 8 1 , 3 1 8 1 , 4,500 4,000 3,500 3,000 2,500 2,000 1,500 1,000 500 0 District 1 District 2 District 3 District 4 District 5 District 6 District 7 District 8 District 9 District 10 FY24 Q2 FY25 Q2 Requests for Service Q2 Comparison - By Call Type (All incidents, regardless of priority) 2,250 1,788 FY25 Q2 FY24 Q2 17,273 103 141 16,544 113 164 6,744 6,888 0% 10% 20% 30% 40% 50% 60% 70% 80% 90% 100% Fire Medical Rescue HazMat Other This document was created by the Austin Fire Department Research & Data Analytics section. Every effort has been made to ensure accuracy. Austin Fire Department | Public Safety Commission Quarterly Report April 24, 2025 Emergency Incidents Q2 Comparison - By Council District (Includes Priority 1, 2, 3, and 4M responses) 8 3 2 2 , 4 6 0 2 , 2 2 2 2 , 8 8 0 2 , 3 6 7 1 , 3 1 6 1 , 8 9 5 1 , 4 8 6 1 , 7 0 5 1 , 2 8 5 1 , 7 1 1 1 , 2 0 0 1 , 4 7 7 1 , 1 7 8 1 , 5 0 0 2 , 3 4 8 1 , 7 9 7 3 4 8 3 0 0 1 , 1 7 9 2,500 2,000 1,500 1,000 500 0 District 1 District 2 District 3 District 4 District 5 District 6 District 7 District 8 District 9 District 10 FY24 Q2 FY25 Q2 Emergency Incidents Q2 Comparison - By Call Type (Includes Priority 1, 2, 3, and 4M responses) 2104 1,586 FY25 Q2 FY24 Q2 14469 13,862 95 87 141 239 152 282 0% 10% 20% 30% 40% 50% 60% 70% 80% 90% 100% Fire Medical Rescue HazMat Other FY24 Q3 FY24 Q4 FY25 Q1 FY25 Q2 Response Time Emergency Incidents Response Time Emergency Incidents Response Time Emergency Incidents Response Time Emergency Incidents District 1 District 2 District 3 District 4 District 5 District 6 District 7 District 8 District 9 District 10 10:44 10:51 11:05 10:31 9:55 10:58 10:13 10:25 9:14 10:46 2,093 1,736 2,151 1,618 1,522 1,051 1,628 803 1,898 1,010 10:28 11:02 10:55 10:47 10:18 10:56 10:26 10:12 08:57 10:41 2,201 1,800 2,294 1,682 1,586 1,079 1,753 791 2,111 982 0:10:33 0:10:51 0:09:54 0:10:41 0:10:19 0:10:47 0:10:31 0:10:28 0:08:55 0:10:28 2,094 1,843 2,182 1,754 1,506 1,081 1,845 878 2,060 985 0:10:42 0:10:22 0:10:17 0:10:30 0:10:39 0:11:21 0:10:34 0:10:16 0:09:09 0:10:20 2,238 1,763 2,222 1,684 1,582 1,117 1,871 843 2,005 1,003 *Emergency incidents are Priorities 1, 2, 3, and 4M responses. Response times include emergency incidents only and are measured at the 90th percentile from the time of call receipt by AFD/ATCEMS Call Taker to the time that the first frontline unit arrives on-scene. This document was created by the Austin Fire Department Research & Data Analytics section. Every effort has been made to ensure accuracy. Austin Fire Department | Public Safety Commission Quarterly Report April 24, 2025 Overdose Response In December 2021, all AFD personnel received hands on training for Naloxone administration and each unit received a stock of the medication. Total calls where Narcan was given Number of times AFD administered or assisted Patient improvement cases FY24 Q3 169 114 114 FY24 Q4 96 53 72 FY25 Q1 88 51 63 FY25 Q2 140 71 106 Investigations *National clearance rate is 22%. Historic (past quarter) data may increase over time due to investigative work. Updated data is provided. Arson fires identified Percent of arson fires cleared Arson fires cleared by arrest Arson fires cleared by citation Office of the Fire Marshal FY24 Q3 47 40% 15 4 FY24 Q4 39 41% 10 6 FY25 Q1 44 43% 13 6 FY25 Q2 34 41% 11 3 The Compliance Engine (TCE) tracks compliance and non-compliance for all fire protection systems in commercial properties across the City of Austin. This allows AFD to track annual fire systems reports, deficiencies and repair reports and receive immediate notification of system impairments. Percentage of City of Austin fire system tracking for compliance and non-compliance FY24 Q3 85% FY24 Q4 85% FY25 Q1 85% FY25 Q2 85% Community Outreach Adjustments to prior quarters reflect event paperwork received after the quarter ended. AFD’s Free Smoke Alarm Program offers smoke alarms to homeowners that live in the City of Austin Fire Department’s Jurisdiction and are in need of working smoke alarms. To participate, call: (512) 974-0299 Number of smoke alarms installed FY24 Q3 192 FY24 Q4 103 FY25 Q1 319 FY25 Q2 277 Community Outreach and firefighters provide vial “hands-on” fire extinguisher training and home safety awareness demonstrations. Fire safety training conducted FY24 Q3 264 FY24 Q4 269 FY25 Q1 295 FY25 Q2 251 Red Angels, with Austin Community College’s nursing program, provides “in-home” health wellness checks (blood pressure, glucose, temperature, heart rate) and conducts home hazard assessments. Red Angels Visits FY24 Q3 0 FY24 Q4 4 FY25 Q1 80 FY25 Q2 84 This document was created by the Austin Fire Department Research & Data Analytics section. Every effort has been made to ensure accuracy.