Item #2 Public Safety Quarterly Report - APD — original pdf
Backup
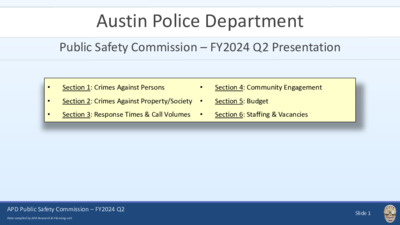
Austin Police Department Public Safety Commission – FY2024 Q2 Presentation • • • Section 1: Crimes Against Persons Section 4: Community Engagement Section 2: Crimes Against Property/Society Section 5: Budget Section 3: Response Times & Call Volumes Section 6: Staffing & Vacancies • • • APD Public Safety Commission – FY2024 Q2 Data compiled by APD Research & Planning unit Slide 1 Crimes Against Persons by Offense Type FY2024 Q2* vs. FY2023 Q2 | FY2024 Q2* vs. 5-Year Mean (Q2) Crimes Against Persons Offense Type 5-Year Mean (FY2019-2023 Q2) FY2023 Q2 FY2024 Q2* 1-Year Change Difference from 5-Year Mean Assault Offenses (13A, 13B, 13C) 4,477 4,233 3,500 Homicide Offenses (09A, 09B) Kidnapping/Abduction (100) Sex Offenses (11A, 11B, 11C, 11D, 36A, 36B) Other Crimes Against Persons (64A, 64B) 16 46 232 3 22 52 202 3 12 46 148 1 -17% -45% -12% -27% -67% Total Crimes Against Persons 4,774 4,512 3,707 -18% -22% *Data for FY2024 Q2 only available through March 20, 2024 APD Public Safety Commission – FY2024 Q2 Data compiled by APD Research & Planning unit -22% -25% 0% -36% -67% Slide 2 Crimes Against Persons by APD Sector FY2024 Q2* vs. FY2023 Q2 Crimes Against Persons APD Sector FY2023 Q2 FY2024 Q2* Adam Baker Charlie David Edward Frank George Henry Ida Other Total 446 392 494 501 769 641 347 499 376 48 381 312 407 383 630 493 262 462 345 33 4,513 3,708 Percent Change -15% -20% -18% -24% -18% -23% -24% -7% -8% -31% -18% APD Public Safety Commission – FY2024 Q2 Data compiled by APD Research & Planning unit Change from FY2023 to FY2024 (Q2) *Data for FY2024 Q2 only available through March 20, 2024 Slide 3 Crimes Against Persons by City Council District FY2024 Q2* vs. FY2023 Q2 Crimes Against Persons City Council District FY2023 Q2 FY2024 Q2* 1 2 3 4 5 6 7 8 9 10 Total Percent Change -20% -20% -10% -16% -27% -22% 4% -30% -28% -14% 454 445 626 625 223 158 356 106 520 168 569 557 696 741 307 202 341 151 721 196 4,481 3,681 -18% APD Public Safety Commission – FY2024 Q2 Data compiled by APD Research & Planning unit Change from FY2023 to FY2024 (Q2) *Data for FY2024 Q2 only available through March 20, 2024 Slide 4 Crimes Against Persons Density (“Hotspots”) FY2024 Q2* vs. FY2023 Q2 Crimes Against Persons FY2023 Q2 FY2024 Q2* Change APD Public Safety Commission – FY2024 Q2 Data compiled by APD Research & Planning unit *Data for FY2024 Q2 only available through March 20, 2024 Slide 5 Crimes Against Property/Society by Offense Type FY2024 Q2* vs. FY2023 Q2 | FY2024 Q2* vs. 5-Year Mean (Q2) Crimes Against Property/Society 5-Year Mean (FY2019-2023 Q2) FY2023 Q2 FY2024 Q2* 1-Year Change Difference from 5-Year Mean Offense Type Robbery (120) Arson (200) Burglary/Breaking & Entering (220) Larceny/Theft Offenses (23A, 23B, 23C, 23D, 23E, 23F, 23G, 23H) Motor Vehicle Theft (240) Counterfeiting/Forgery (250) Fraud Offenses (26A, 26B, 26C) Destruction/Damage/Vandalism of Property (290) Drug/Narcotic Offenses (35A, 35B) Pornography/Obscene Material (370) Prostitution Offenses (40A, 40B, 40C) Weapon Law Violations (520) Animal Cruelty (720) APD Public Safety Commission – FY2024 Q2 Data compiled by APD Research & Planning unit 241 32 1,106 6,308 1,026 246 1,748 1,605 1,250 73 19 221 50 19 271 37 1,231 5,824 1,477 213 1,450 1,460 1,237 76 23 314 54 20 178 37 829 4,279 1,488 85 870 1,260 1,122 53 18 230 67 13 -34% 0% -33% -27% 1% -60% -40% -14% -9% -30% -22% -27% 24% -35% -26% 16% -25% -32% 45% -65% -50% -21% -10% -27% -5% 4% 34% -32% Slide 6 Other Offenses Against Property/Society (210, 270, 280, 39A, 39B, 39C, 510) Total Crimes Against Property/Society 13,945 13,687 10,529 -23% -24% *Data for FY2024 Q2 only available through March 20, 2024 Crimes Against Property/Society by APD Sector FY2024 Q2* vs. FY2023 Q2 Crimes Against Property/Society APD Sector FY2023 Q2 FY2024 Q2* Adam Baker Charlie David Edward Frank George Henry Ida Other Total Percent Change -26% -30% -18% -38% -24% -21% -4% -23% -20% -32% 1,356 1,207 1,119 1,321 1,285 1,221 845 1,130 897 157 1,834 1,717 1,372 2,129 1,697 1,540 879 1,462 1,119 232 13,981 10,538 -25% APD Public Safety Commission – FY2024 Q2 Data compiled by APD Research & Planning unit Change from FY2023 to FY2024 (Q2) *Data for FY2024 Q2 only available through March 20, 2024 Slide 7 Crimes Against Property/Society by City Council District FY2024 Q2* vs. FY2023 Q2 Crimes Against Property/Society City Council District FY2023 Q2 FY2024 Q2* 1 2 3 4 5 6 7 8 9 10 Total 1,326 1,293 2,226 1,663 1,047 706 1,568 790 2,285 968 1,029 1,058 1,723 1,332 701 535 1,117 455 1,960 562 13,872 10,472 Percent Change -22% -18% -23% -20% -33% -24% -29% -42% -14% -42% -25% APD Public Safety Commission – FY2024 Q2 Data compiled by APD Research & Planning unit Change from FY2023 to FY2024 (Q2) *Data for FY2024 Q2 only available through March 20, 2024 Slide 8 Crimes Against Property/Society Density (“Hotspots”) FY2024 Q2* vs. FY2023 Q2 Crimes Against Property/Society FY2023 Q2 FY2024 Q2* Change APD Public Safety Commission – FY2024 Q2 Data compiled by APD Research & Planning unit *Data for FY2024 Q2 only available through March 20, 2024 Slide 9 Citywide Response Times and Call Volume FY2024 Q2* Response Times & Call Volumes Emergency (P0) + Urgent (P1) Citywide Target 2024 Jan 2024 Feb 2024 Mar* Average Response Time 00:10:44 0:12:27 0:11:49 00:11:39 Call Volumes N/A 6,596 6,653 4,826 APD Public Safety Commission – FY2024 Q2 Data compiled by APD Research & Planning unit *Data for FY2024 Q2 only available through March 20, 2024 Slide 10 Response Times and Incident Volume by City Council District FY2024 Q2* Response Times & Call Volumes Council District 1 Council District 2 Council District 3 Council District 4 Council District 5 Priority Call Volume Average Response Time Priority Call Volume Average Response Time Priority Call Volume Average Response Time Priority Call Volume Average Response Time Priority Call Volume Average Response Time Totals Totals 10,083 N/A Totals 12,220 N/A Totals Totals Council District 6 Council District 7 Council District 8 Council District 9 Council District 10 Priority Call Volume Average Response Time Priority Call Volume Average Response Time Priority Call Volume Average Response Time Priority Call Volume Average Response Time 2 Priority Call Volume Average Response Time 0 1 2 3 0 1 2 3 1,000 1,267 3,335 3,361 8,963 00:11:05 00:13:53 00:37:31 01:28:06 N/A 507 568 1,651 1,148 3,874 00:12:32 00:19:01 00:40:36 01:31:51 N/A 0 1 2 3 0 1 2 3 763 1,173 3,305 4,842 00:10:01 00:14:39 00:40:45 01:23:50 1,247 1,681 4,686 4,606 00:08:34 00:11:43 00:35:49 01:31:20 951 1,114 3,721 2,612 8,398 00:10:07 00:16:10 00:33:03 01:28:27 N/A 390 368 1,129 610 2,497 00:10:59 00:15:49 00:35:08 01:16:16 N/A 0 1 2 3 0 1 2 3 0 1 2 3 0 1 2 3 1,050 1,432 3,867 3,247 9,596 00:08:45 00:12:49 00:36:54 01:35:29 N/A 778 1,445 4,928 7,848 00:07:45 00:10:32 00:25:19 00:57:28 Totals Totals Totals Totals 14,999 N/A Totals *Data for FY2024 Q2 only available through March 20, 2024 0 1 2 3 0 1 2 3 555 863 2,672 1,527 5,617 00:09:31 00:13:52 00:37:25 01:20:32 N/A 473 412 1,511 900 3,296 00:11:07 00:17:36 00:30:25 01:15:43 N/A Slide 11 APD Public Safety Commission – FY2024 Q2 Data compiled by APD Research & Planning unit Emergency (P0) & Urgent (P1) Call Volume by Month FY2024 Q2* Response Times & Call Volumes Emergency (P0) & Urgent (P1) Call Volume Urgent (P1) Call Volume Emergency (P0) Call Volume 2,837 2,905 3,810 3,807 2,042 2,827 2024 JAN 2024 FEB 2024 MAR* APD Public Safety Commission – FY2024 Q2 Data compiled by APD Research & Planning unit *Data for FY2024 Q2 only available through March 20, 2024 Slide 12 Community Engagement FY2024 Q2 Community Engagement APD Public Safety Commission – FY2024 Q2 Data compiled by APD Research & Planning unit Slide 13 Overtime Budget vs. Hours Worked 2023-Sep-24 through 2024-Mar-9 Budget APD Budgeted Overtime vs. Actual Overtime* 9/24/23 - 3/09/24 $25,725,136 81% Spent $20,937,845 Officers working overtime: 1,464 Overtime hours worked: 241,332 Overtime Budget Overtime Expenditures *Does not include reimbursed overtime or COVID FEMA APD Public Safety Commission – FY2024 Q2 Data compiled by APD Research & Planning unit Slide 14 Personnel Budget vs. Total Expenditures 2023-Sep-24 through 2024-Mar-9 Budget APD Personnel Budget vs Personnel Expenditures 9/24/23 - 3/09/24 $369,103,295 46.6% Spent $172,118,872 Personnel Budget Personnel Expenditures APD Public Safety Commission – FY2024 Q2 Data compiled by APD Research & Planning unit Slide 15 Cadet Classes 2024 CURRENT CLASSES • 150th/151st Cadet Class Started 9/11/23 with 49 cadets • • Currently 40 cadets • Graduation 4/19/24 • 152nd Cadet Class Started 2/12/24 with 79 cadets • • Currently 71 cadets • Graduation 9/20/24 Staffing & Vacancies FUTURE SCHEDULED CLASSES • 153rd Cadet Class Starts 7/15/24 • • Currently ~119 in hiring process • Graduation date set for 3/7/2025 • 154th Cadet Class • Starts January 2025 RECENT GRADUATES • 148th Cadet Class Started 1/30/2023 with 34 cadets • Graduated 9/8/23 with 19 • 149th Cadet Class Started 05/29/2023 with 34 cadets • Graduated 1/5/24 with 25 • • APD Public Safety Commission – FY2024 Q2 Data compiled by APD Research & Planning unit Slide 16 Staffing levels FY2024 Q2 Staffing & Vacancies Filled Vacancies Hired 7 new civilian staff to directly assist with implementation of the Kroll Report recommendations at the Academy 342 1,470 75 685 SWORN (1,812) CIVILIAN (760) 43 179 EMERGENCY COMMS- CIVILIAN (222) APD Public Safety Commission – FY2024 Q2 Data compiled by APD Research & Planning unit Slide 17 Patrol Officer Staffing & Vacancies by Area Command (as of March 25, 2024) Staffing & Vacancies APD Public Safety Commission – FY2024 Q2 Data compiled by APD Research & Planning unit Slide 18 APD Open Data Portal www.austintexas.gov/apd-data-portal APD Public Safety Commission – FY2024 Q2 Data compiled by APD Research & Planning unit Slide 19