Item 6: Statistical Trends Jan-Mar 2021 — original pdf
Backup
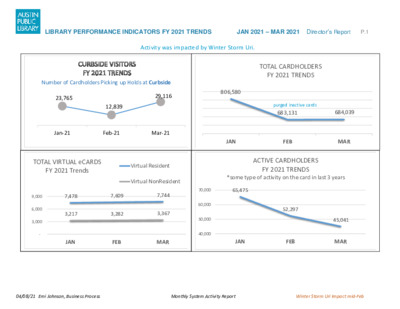
LIBRARY PERFORMANCE INDICATORS FY 2021 TRENDS JAN 2021 – MAR 2021 Director’s Report P.1 Activity was impacted by Winter Storm Uri. Number of Cardholders Picking up Holds at Curbside 23,765 12,839 29,116 806,580 Jan-21 Feb-21 Mar-21 TOTAL VIRTUAL eCARDS FY 2021 Trends Virtual Resident Virtual NonResident 7,478 3,217 7,609 3,282 7,744 3,367 9,000 6,000 3,000 - 70,000 60,000 50,000 40,000 TOTAL CARDHOLDERS FY 2021 TRENDS purged inactive cards 683,131 684,039 JAN FEB MAR ACTIVE CARDHOLDERS FY 2021 TRENDS *some type of activity on the card in last 3 years 65,475 52,297 45,041 JAN FEB MAR JAN FEB MAR 04/08/21 Emi Johnson, Business Process Monthly System Activity Report Winter Storm Uri Impact mid-Feb LIBRARY PERFORMANCE INDICATORS FY 2021 TRENDS JAN 2021 – MAR 2021 Director’s Report P.2 LIVE PROGRAMS FY 2021 TRENDS 55 30 28 JAN FEB MAR REFERENCE ASSISTANCE FY 2021 TRENDS 2,753 2,573 3,080 JAN FEB MAR 60 40 20 0 4,000 3,000 2,000 LIVE PROGRAMS MAR 2021 Live Programs Attendees 593 600 400 200 0 108 11 10 62 34 Adult/Family Teen Children WIFI CONNECTIONS FY 2021 TRENDS LIBRARY WEBSITE HITS FY 2021 TRENDS 7,953 6,785 9,345 1,533,694 1,238,634 1,446,860 JAN FEB MAR JAN FEB MAR 04/08/21 Emi Johnson, Business Process Monthly System Activity Report Winter Storm Uri Impact mid-Feb LIBRARY PERFORMANCE INDICATORS FY 2021 TRENDS JAN 2021 – MAR 2021 Director’s Report P.3 PHYSICAL CIRCULATION BY ITEM TYPE JAN FEB MAR Children Book Adult Book Teen Book Adult Video Teen Video Adult Music Children Music Adult AudioBook Children AudioBook Teen AudioBook Hotspots JAN FEB MAR 75,768 64,293 69,847 54,708 47,004 48,607 7,039 5,866 6,878 13,943 11,260 11,719 541 436 392 3,945 3,139 3,476 175 119 95 1,625 1,194 1,289 468 391 343 119 83 96 50 24 89 Children Video 2,707 1,915 1,954 PHYSICAL CIRCULATION FY 2021 TRENDS 161,356 136,031 145,116 PHYSICAL CIRCULATION ADULT v. YOUTH FY 2021 TRENDS JAN FEB MAR 74,221 62,597 65,091 87,061 73,388 79,879 Jan-21 Feb-21 Mar-21 Adult Items Youth Items 04/08/21 Emi Johnson, Business Process Monthly System Activity Report Winter Storm Uri Impact mid-Feb 12,000 10,000 8,000 6,000 4,000 2,000 0 5,000 3,800 2,600 1,400 200 LIBRARY PERFORMANCE INDICATORS FY 2021 TRENDS JAN 2021 – MAR 2021 Director’s Report P.4 CURBSIDE HOLDS PICK-UP TRENDS The number of items picked-up at curbside libraries. FEB MAR JAN Carver Branch Central Library Milwood Branch Manchaca Road Branch North Village Branch Old Quarry Branch Ruiz Branch Spicewood Springs Branch University Hills Branch Windsor Park Branch JAN FEB MAR 2,330 1,921 2,595 6,848 4,725 7,914 5,279 3,685 6,404 8,423 5,904 9,651 8,270 5,890 9,731 4,278 3,068 4,948 1,625 1,073 1,963 8,672 5,491 10,439 1,108 589 3,934 3,226 5,695 Hampton Branch at Oak Hill 9,176 5,764 11,329 CURBSIDE VISITOR TRENDS The number of unique cardholders picking up items at curbside libraries. JAN FEB MAR Carver Branch Central Library Milwood Branch Manchaca Road Branch North Village Branch Old Quarry Branch Ruiz Branch Spicewood Springs Branch University Hills Branch Windsor Park Branch JAN FEB MAR 1,005 785 1,187 2,660 1,934 3,216 2,092 1,448 2,560 3,288 2,271 3,865 3,321 2,332 4,003 1,798 1,293 2,171 637 412 787 3,413 2,214 4,278 419 212 1,629 1,257 2,375 Hampton Branch at Oak Hill 3,503 2,364 4,674 04/08/21 Emi Johnson, Business Process Monthly System Activity Report Winter Storm Uri Impact mid-Feb LIBRARY PERFORMANCE INDICATORS FY 2021 TRENDS JAN 2021 – MAR 2021 Director’s Report P.5 CURBSIDE Cardholders (Visitors) Picking Up Holds and Number of Holds Picked Up MARCH 2021 Cardholders Picking Up Holds Number of Items Picked Up 9,651 9,731 11,329 10,439 7,914 6,404 3,216 2,595 2,560 2,000 1,187 3,865 4,003 4,674 4,948 4,278 2,171 1,963 787 5,695 2,375 12,000 10,000 8,000 6,000 4,000 - Carver Branch Central Library Milwood Branch Manchaca Road Branch North Village Branch Hampton Branch at Oak Hill Old Quarry Branch Ruiz Branch Spicewood Windsor Park Branch Springs Branch 04/08/21 Emi Johnson, Business Process Monthly System Activity Report Winter Storm Uri Impact mid-Feb LIBRARY PERFORMANCE INDICATORS FY 2021 TRENDS JAN 2021 – MAR 2021 Director’s Report P.6 N E W M AT E R I A L S A D D E D T O C O L L E C T I O N S A N N U A L T R E N D S C O L L E C T I O N S S I Z E A N N U A L T R E N D S New Physical Materials Added New Virtual Materials Added Physical Collection Size Virtual Collection Size 210,047 194,382 162,104 157,057 173,282 95,044 1,041,403 1,198,954 1,184,410 865,875 864,951 881,748 925,547 EOY 2018 EOY 2019 EOY 2020 YTD 2021 EOY 2018 EOY 2019 EOY 2020 YTD 2021 64,777 25,012 04/08/21 Emi Johnson, Business Process Monthly System Activity Report Winter Storm Uri Impact mid-Feb