Austin Water Staff Briefing Presentation — original pdf
Backup
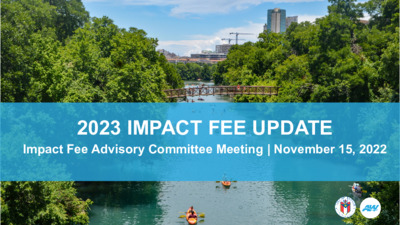
2023 IMPACT FEE UPDATE Impact Fee Advisory Committee Meeting | November 15, 2022 FY2022 FY2023 FY2024 Land Use Assumptions CIP Plan Assessed & Collected Fees Public Involvement Project Schedule Maximum Allowable Fee Full Report Today Stakeholder Involvement Impact Fee Basics Impact Fee “…a charge or assessment imposed by a political subdivision against new development in order to generate revenue for funding or recouping the costs of capital improvements or facility expansions necessitated by and attributable to the new development” (Texas LGC 395.001.4) Land Use Assumptions (Section 2) What infrastructure capacity will be consumed by new development? Capital Improvements Plan (Section 3) What is that infrastructure capacity worth? Assessed & Collected Fees (Section 1) How much are we going to charge? Questions Impact Fees - 2023 Update State mandated minimum 5-year update of Water and Wastewater impact fees Followed same basic method as previous two updates (2013 & 2018) • Land Use assumptions • Capital Improvement Plan Land Use Assumptions Updates Service area update Impact fee demographic data updates: • 2020 and 2030 • Population and employment 10-year Service Unit (SU) growth projection Service area updates reflect: ETJ changes Other jurisdictional changes Population and Employee Estimates WATER WASTEWATER 2020 2030 2020 2030 1,030,610 1,252,807 988,997 1,211,194 50,481 54,481 41,517 44,071 Total Population 1,081,091 1,307,738 1,030,514 1,255,265 683,847 803,260 657,925 776,835 20,528 25,023 18,552 22,348 704,375 828,283 676,477 799,183 Retail Population Wholesale Population Retail Employees Wholesale Employees Total Employees Capital Improvement Plan Updates Updated projects included in fee calculation Included projects that have capacity to serve growth in 10-year horizon Walnut Creek Wastewater Treatment Plant expansion project included in Wastewater Fee calculation Future Reclaimed Water projects included in Water Fee calculation Service Units & Ten-Year Growth Service Unit Growth based on Meter Inventory Impact fees assessed by meter size and type Growth expressed in terms of “Service Units” (SUs) to provide a common measure of growth across all meters One SU equals one 5/8” residential meter Larger meter sizes calculated as equivalent multiples of SUs based on AWWA recommended meter flow capacities SU growth reflects additional factors of population and employment growth, and customer water demand trends Ten-year SU growth projection (Water) s t i n U e c i v r e S l a t o T 470,000 450,000 430,000 410,000 390,000 370,000 350,000 • 2023 Draft Report: 88k • 2018 Report: 99k • 2013 Report: 72k y = 8,115x + 350,127 Increase in last 10 years: ~81k SU’s Maximum Allowable Fee Calculation Total cost of projects that have capacity to serve growth in 10-year horizon ($4.9B) • 143 Water projects, 8 Reclaimed projects, and 119 Wastewater projects Most significant driver of cost increase: Walnut Creek Wastewater Treatment Plant expansion Total impact cost is the capacity-based share of the total cost associated with projected 10-year growth Rate revenue and defeasance savings included as credits Total Maximum Allowable Costs = Total Impact Costs - Credits Total Project Costs ($1,000s) Total Impact Costs ($1,000s) Rate Revenue & Defeasance Credits ($1,000s) Total Max Allowable Cost ($1,000s) Water $2,343,213 $678,830 -$237,000 $429,830 Wastewater $2,529,126 $524,669 -$266,000 $258,669 Total $4,872,339 $1,203,499 -$503,000 $688,499 Maximum Allowable Fee Calculation Total Max Allowable Cost ($1,000s) Projected 10-yr Service Unit Growth Water Wastewater $429,830 $258,669 88,046 87,121 Maximum Allowable Fee ($/SU) $4,882 $2,969 Total maximum allowable cost divided by projected 10- year service unit growth = Maximum Allowable fee per service unit Questions Maximum Allowable Impact Fees Water Wastewater 2013 $5,415 $2,284 2018 $4,752 $2,572 2023 $4,882 $2,969 t i n U e c v r e S / $ i $10,000 $8,000 $6,000 $4,000 $2,000 $0 Wastewater Water 2013 2018 2023 Proposed Assessed Impact Fees 2013 Approved 2018 Approved 2023 Proposed Water Wastewater TOTAL $5,400 $2,200 $7,600 $4,700 $2,500 $7,200 $4,800 $2,900 $7,700 Wastewater Water t i n U e c v r e S / $ i $10,000 $8,000 $6,000 $4,000 $2,000 $0 2013 Approved 2018 Approved 2023 Proposed Schedule and Next Steps Next IFAC meeting, present draft Impact Fee Report Gather stakeholder input Follow State Law requirements for hearings and postings Seek City Council approval of new fees in August 2023 with budget process for FY24 Questions Total Costs & Credits Comparison TOTAL PROJECT COSTS ($1,000s) % INCREASE TOTAL IMPACT COSTS ($1,000s) % INCREASE 2013 Report 2018 Report 2023 Proposed Ten Year 13 - 23 Five Year 18 - 23 2013 Report 2018 Report 2023 Proposed Ten Year 13 - 23 Five Year 18 - 23 W $2,086,259 WW $1,050,394 Total $3,136,653 $2,243,339 $2,343,213 12% $1,119,882 $2,529,126 141% $3,363,221 $4,872,339 55% 4% 126% 45% $604,313 W WW $248,365 $629,496 $678,830 $337,790 $524,669 12% 111% Total $852,678 $967,286 $1,203,499 41% 8% 55% 24% RATE CREDIT & DEFEASANCE ($1,000s) % INCREASE TOTAL MAX ALLOWABLE COST ($1,000s) % INCREASE 2013 Report 2018 Report 2023 Proposed Ten Year 13 - 23 Five Year 18 - 23 2013 Report 2018 Report 2023 Proposed Ten Year 13 - 23 Five Year 18 - 23 W ($214,085) WW ($86,861) ($300,946) Total ($157,854) ($81,050) ($249,000) ($266,000) ($238,904) ($515,000) 16% 206% 71% 58% 228% 116% $390,228 W WW $161,504 $551,732 Total $471,642 $256,740 $429,830 $258,669 $728,382 $688,499 10% 60% 25% -9% 1% -5% PROJECTED 10-YR SERVICE UNIT GROWTH % INCREASE 2013 Report 72,920 70,288 2018 Report 99,251 99,819 2023 Proposed Ten Year 13 - 23 Five Year 18 - 23 88,046 87,121 21% 24% -11% -13% W WW MAX ALLOWABLE IMPACT FEE ($/SU) % INCREASE 2013 Report $5,400 $2,200 $7,600 W WW Total 2018 Report $4,700 $2,500 $7,200 2023 Proposed $4,800 $2,900 $7,700 Ten Year 13 - 23 -11% 32% 1% Five Year 18 - 23 2% 16% 7%