HRC 20200518-002b Texas Appleseed Presentation — original pdf
Backup
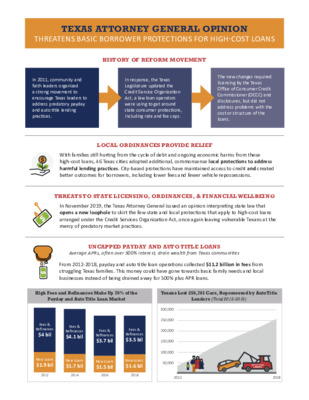
TEXAS ATTORNEY GENERAL OPINION THREATENS BASIC BORROWER PROTECTIONS FOR HIGH-COST LOANS HISTORY OF REFORM MOVEMENT In 2011, community and faith leaders organized a strong movement to encourage Texas leaders to address predatory payday and auto title lending practices. In response, the Texas Legislature updated the Credit Service Organization Act, a law loan operators were using to get around state consumer protections, including rate and fee caps. The new changes required licensing by the Texas Office of Consumer Credit Commissioner (OCCC) and disclosures, but did not address problems with the cost or structure of the loans. LOCAL ORDINANCES PROVIDE RELIEF With families still hurting from the cycle of debt and ongoing economic harms from these high-cost loans, 46 Texas cities adopted additional, commonsense local protections to address harmful lending practices. City-based protections have maintained access to credit and created better outcomes for borrowers, including lower fees and fewer vehicle repossessions. $250,000 $250,000 $200,000 $300,000 $300,000 $300,000 $250,000 $200,000 $200,000 $150,000 $150,000 $150,000 $100,000 $100,000 $100,000 THREATS TO STATE LICENSING, ORDINANCES, & FIN ANCIAL WELLBEING In November 2019, the Texas Attorney General issued an opinion interpreting state law that opens a new loophole to skirt the few state and local protections that apply to high-cost loans arranged under the Credit Services Organization Act, once again leaving vulnerable Texans at the mercy of predatory market practices. $50,000 $50,000 $50,000 $300,000 $250,000 2012 2012 2012 2018 2018 2018 $200,000 $150,000 $100,000 UNCAPPED PAYDAY AND AUTO TITLE LOANS Average APRs, often over 500% interest, drain wealth from Texas communities $50,000 From 2012-2018, payday and auto title loan operations collected $11.2 billion in fees from struggling Texas families. This money could have gone towards basic family needs and local businesses instead of being drained away for 500% plus APR loans. 2012 2018 High Fees and Refinances Make Up 70% of the Texans Lost 256,701 Cars, Repossessed by Auto Title Payday and Auto Title Loan Market Lenders (Total 2012-2018) Fees & Refinances $4 bil Fees & Refinances $4.1 bil Fees & Refinances $3.7 bil Fees & Refinances $3.5 bil 2012 2012 New Loans $1.9 bil New Loans $1.7 bil New Loans $1.5 bil New Loans $1.6 bil 2012 2012 2014 2016 2018 300,000 250,000 200,000 150,000 2014 2014 100,000 50,000 2014 2016 2016 2018 2018 2016 2018 2012 2018 AUTO TITLELENDERPAYDAY LOANSAUTO TITLELENDERAUTO TITLELENDERPAYDAY LOANSAUTO TITLELENDERAUTO TITLELENDERPAYDAY LOANSAUTO TITLELENDERAUTO TITLELENDERPAYDAY LOANSAUTO TITLELENDERAUTO TITLELENDERPAYDAY LOANSAUTO TITLELENDER IMPACTS OF THE ATTORNEY GENERAL OPINION ON LAWS GOVERNING HIGH-COST LOANS IN TEXAS Standards for Loan Operators Using the Credit Services Organizations Act (State Oversight) Before the Opinion (2012-2018) After the Opinion (Beginning Nov. 2019) OCCC Licensing Required Optional Enforcement of Military Lending Act protections Enforced by OCCC Enforcement against unlawfully using criminal charges against a consumer to collect a debt Enforced by OCCC Enforcement of Fair Debt Collections compliance Enforced by OCCC Unclear Unclear Unclear Optional Disclosure and reporting requirements Applicable to all loans and enforced by OCCC Standards Supporting Loan Affordability and Addressing the Harmful Cycle of Debt Before the Opinion (2012-2018) After the Opinion (Beginning Nov. 2019) Loan size limit based on borrower income Enforced through city ordinances Optional Each payment must reduce total owed by 25% Enforced through city ordinances Optional Limits on refinances Enforced through city ordinances Optional $300,000 WHERE DOES THIS LEAVE TEXANS? The few protections that were helpful for Texas borrowers are now optional or unclear, leaving more people trapped in a harmful cycle of debt with no clear options for relief. $250,000 $200,000 $150,000 FOR MORE INFORMATION Texas AG Opinion: https://www.texasattorneygeneral.gov/sites/default/files/opinion-files/opinion/2019/kp-0277.pdf $100,000 http://www.texasfairlending.org/wp-content/uploads/2019/11/New-Texas-Attorney-General-Opinion-Opens-Yet-Anoth- $50,000 TFLA AG Opinion Press Release: er-Loophole-for-Predatory-Lending-in-Texas.pdf 2012 2018 Payday and Auto Title Lending Data Sheet, 2018, State of Texas: https://www.texasappleseed.org/sites/default/files/Texas2018.pdf CONTACT US Texas Fair Lending Alliance Supporting a Texas market that encourages informed financial choices that are successful for both borrowers and lenders www.TexasFairLending.org Ann Baddour: abaddour@texasappleseed.net | Stephanie Mace: smace@unitedwaydallas.org AUTO TITLELENDERPAYDAY LOANSAUTO TITLELENDER Payday and Auto Title Lending in Texas Austin MSA 2018 Austin-Round Rock-San Marcos • Store Locations: 99 • New Loans: $43,632,273 • Fee Charges: $57,338,399 • Refinances: $49,777,567 • Repossessions (Auto Title): 1,745 or 34 cars per week • Repossession Rate: 17% of borrowers had car repossessed Refinances and High Fees Continue to Drive Costs Payday and auto title businesses in Texas offer two main loan types: single payment loans, due in full in 2 weeks or 1 month, and installment loans, due in a series of payments over a period of up to 6 months. Longer loan terms mean installment loans have fewer refinances, but even higher fees. Fees for one installment loan are often the same as fees charged for 5 to 12 single payment loans. • • In the Austin MSA, refinances make up 64% of single payment loan transactions. Installment loan borrowers paid a total of $48,494,347 in fees for $28,012,544 in new loans, an average of $173 in fees for every $100 borrowed. • Across all four loan types, the average cost to repay a $500 loan with no refinances is $583 to $1,415. For borrowers who refinance, the average cost to repay a $500 loan can reach over $3,000. Average APRs for payday and auto title loans in the Austin MSA range from 203% to 552% (see table on back). 2018 Dollar Amount of New Loans, Fees, and Refinances Austin MSA $75 mil $50 mil s r a l l o D $25 mil $0 Installment Single Payment Payday Payday Installment Auto Title Single Payment Auto Title New Loans Fees Refinances Texas A P P L E S E E D 38% Source: Texas Appleseed analysis of Texas Office of Consumer Credit Commissioner 2017 and 2018 Credit Access Business Quarterly and Annual Data Reports. Store location data is based on the Office of Consumer Credit Commissioner CAB licensing data for December 2018, and includes only active licensed locations in Texas. 58% 8% 27% 25% 19% Payday and Auto Title Lending in Texas Austin MSA at a Glance: Profile of Loan Terms and Repayment, $500 Loan Installment Single Payment Payday Payday Installment Auto Title Single Payment Auto Title Average Loan Term (Days) 168 18 154 30 Average Fees per $100 $178.34 $22.43 $106.84 $15.85 Ave. Annual Percentage Rate (APR) 552% 465% 393% 203% Amount Repaid with No Refinances $1,414.73 $614.56 $1,055.25 $583.37 Ave. % of Borrowers Who Refinance in Same Quarter They Take Out a Loan 6.78% 50.59% 7.19% 50.28% Average Refinances per Borrower 3.71 5.47 6.43 3.62 Amount Repaid with Ave. Refinances $4,807.09 $1,241.32 $4,626.96 $885.27 Refinances as Percent of Total Number of Loan Transactions 16% 62% 28% 69% Small Increase in Market Volume; Installment Auto Title Lending on the Rise The total value of new loans, fees, and refinances increased by 8% from 2017 to 2018. During that same period, the dollar value of new loans increased by 11%, refinances rose by 7%, and fees increased by 5%. There was a 48% increase in vehicle repossessions by auto title lenders, from 1,182 cars in 2017 to 1,745 in 2018. The repossession rate increased from 14% of auto title loan borrowers losing a car in 2017 to 17% in 2018. Installment auto title lending grew both as a percentage of dollars lent and of fees, increasing from 9% of dollars lent and 18% of fees collected in 2017 to 18% of dollars lent and 27% of fees collected in 2018. Austin MSA 2018 Comparison of Total Dollars Lent to Total Fees % of Total Dollars Lent 25% 19% 38% 18% % of Total Fees 8% 27% 8% 58% Installment Payday Single Payment Payday Installment Auto Title Single Payment Auto Title Numbers may not add up to 100% due to rounding error. Texas A P P L E S E E D Source: Texas Appleseed analysis of Texas Office of Consumer Credit Commissioner 2017 and 2018 Credit Access Business Quarterly and Annual Data Reports. Store location data is based on the Office of Consumer Credit Commissioner CAB licensing data for December 2018, and includes only active licensed locations in Texas. The Impact of the Unified Payday and Auto Title Loan Ordinance Executive Summary In an effort to combat harmful effects on local residents of the on-going cycle of debt caused by uncapped payday and auto title loans, Texas cities began adopting a unified payday and auto title loan ordinance, starting in 2011. The unified ordinance, now in place in 45 Texas cities, includes a baseline of consistent standards to address the cycle of debt and unaffordable loans by: limiting the size of payday and auto title loans based on borrower income; limiting the loans to a total of four payments (these loans have traditionally been marketed as single payment two-week loans); requiring each payment to reduce the loan principal by 25%; and limiting refinances. This report investigates the impact of the unified ordinance based on the payday and auto title loan market data reported by payday and auto title loan businesses to the Texas Office of Consumer Credit Commissioner, including the number of borrowers, number of new loans, number of refinances, dollar amount of new loans, dollar amount of refinances, dollar amount of fees, and number of vehicle repossessions (by auto title loan businesses). The following report summarizes analyses regarding two overarching questions: (1) have there been changes in the overall payday and auto title loan market from 2012 to 2017 and (2) what is the specific impact of the expanded adoption of the unified payday and auto title loan ordinance on borrower outcomes? Regarding our first research question, results from our analyses suggest that since 2012, there have been statistically significant decreases in: • Total number of borrowers • Total number of new loans • Total number of refinances • Total dollar amount of new loans • Total dollar amount refinanced • Total number of vehicle repossessions • Total number of new loans • Total number of refinances • Total dollar amount of new loans • Total dollar amount of fees • Total number of vehicle repossessions There was no statistically significant change in the dollar amount of fees overall from 2012 to 2017. Regarding the second research question, results from analyses suggest that implementation of the unified ordinance has had a meaningful impact on outcomes for borrowers. Specifically, analyses suggest that the unified ordinance is associated with statistically significant decreases in: The results from these analyses suggest that although there has been a significant decrease in the number of borrowers, the decrease is not due to the proportion of payday and auto title loan store locations that fall under the unified ordinance. Additionally, while the total dollar Texas Appleseed | 1609 Shoal Creek Blvd, Suite 201, Austin, TX 78701 | www.TexasAppleseed.org amount of fees overall has not significantly changed from 2012 to 2017, there is a significant impact of the unified ordinance on the dollar amount of fees, such that greater implementation of the unified ordinance is associated with lower total fees. Taken together, these analyses suggest that the unified ordinance is associated with beneficial outcomes for borrowers, in terms of improved affordability of the loans. Borrowers experience fewer new loans—which may be associated with less borrowing due to financial difficulties caused by a previous loan – fewer refinances of existing loans, lower fees, and fewer vehicle repossessions, yet people continue to have access to these loans. Yet, Texas has no rate or fee caps for these loans, which can average over 500% APR. Building on the foundation of the unified ordinance, implementing statewide rate and fee caps would further enhance affordability for borrowers. However, the promising results of this study demonstrate the benefits of even basic affordability provisions that limit the cycle of ongoing high-cost debt to improve borrower outcomes. 2 The Unified Ordinance The unified ordinance establishes basic affordability standards for people taking out payday and auto title loans. Dallas and Austin first adopted the unified ordinance in 2011, and it went into effect in those cities in 2012. Since then, a total of 45 cities have adopted the unified ordinance. At least 10 million Texans are covered by the unified ordinance. The main components of the unified ordinance include: • Payday and auto title stores operating as credit access businesses must register with the city • Payday loans including all charges are limited to 20% of the borrower’s gross monthly income. Auto title loans including all charges are limited to the lesser of 3% of the borrower’s gross annual income or 70% of the vehicle value • Loans cannot have more than 4 installments or 3 rollovers or renewals • The proceeds from each installment or renewal must reduce the loan principal by 25% • A rollover or renewal is defined as an extension of consumer credit made within seven days of the previous extension of credit This report investigates the impact of the unified ordinance on outcomes for Texas borrowers over time. Methodology Data used in this report was obtained through open records requests to the Texas Office of Consumer Credit Commissioner. It includes data from the credit access business quarterly and annual reports submitted to the Office from 2012 through 2017 for the State of Texas and for a subset of state metropolitan statistical areas and metropolitan divisions. Specifically, we pulled data on each loan type (i.e., installment payday loan, single payment payday loan, installment auto title loan, and single payment auto title loan) for sixteen metropolitan statistical areas (MSA) or metropolitan divisions (MD) where data is available. For each of the years in the study and for each loan type, data was compiled on the number of borrowers, the number of new loans issued, the number of refinanced loans, the dollar amount of loans issued, the dollar amount of refinances, the dollar amount of fees, and total number of vehicle repossessions. Please see the Appendix for definitions of these variables. Analyses were conducted on the outcomes of total number of borrowers, number of new loans, refinanced loans, dollar amount of loans, dollar amount of refinances, dollar amount of fees, and vehicle repossessions (for vehicle repossessions) across all loan types. In order to account for different population sizes across each MSA/MD, each outcome was weighted by adult population (18 and older) and multiplied by 10,000 in order to be standardized across MSAs/MDs.1 In order to assess the impact of the unified ordinance, we created a variable that captures the proportion of loan providers that would fall under the unified ordinance for each MSA/MD, based on a list of licensed locations for each year included in the study. The list of licensed locations was obtained from the Texas Office of Consumer Credit Commissioner through open records requests. The proportion unified ordinance variable was measured on a scale of 0%-100% of locations that were regulated by the unified ordinance. Findings In order to assess whether there was any change in the market indicators from 2012 to 2017, a series of paired sample t-tests were conducted for each outcome type.2 Overall, results found that from 2012 to 2017 there was a statistically significant decrease in the total number of borrowers, the total number of news loans, the total number of refinances, and the total number of vehicle repossessions. 3 Number of Borrowers per 10,000 Adults (2012, 2017) 2012 2017 All* 434 809 Amarillo, TX MSA 131 Austin-Round Rock-San Marcos, TX MSA 279 Beaumont-Port Arthur, TX MSA Brownsville-Harlingen, TX MSA College Station-Bryan, TX MSA 186 597 578 465 514 754 825 793 Corpus Christi, TX MSA Dallas-Plano-Irving, TX MD El Paso, TX MSA Fort Worth-Arlington, TX MD Houston-Sugar Land-Baytown, TX MSA Killeen-Temple-Fort Hood, TX MSA Laredo, TX MSA Lubbock, TX MSA McAllen-Edinburg-Mission, TX MSA San Antonio-New Braunfels, TX MSA Waco, TX MSA 1,089 1,111 695 672 887 825 1,335 404 376 365 421 340 352 537 652 650 679 515 446 523 600 916 829 0 200 400 800 1,000 1,200 1,400 1,600 Number of Borrowers per 10,000 Adults *Note: Numbers in the ‘all’ category reflect weighted median borrowers per 10,000 adults across all 16 MSAs/MDs. 4 Number of New Loans per 10,000 Adults (2012, 2017) 2012 2017 All* Amarillo, TX MSA Austin-Round Rock-San Marcos, TX MSA Beaumont-Port Arthur, TX MSA Brownsville-Harlingen, TX MSA College Station-Bryan, TX MSA Corpus Christi, TX MSA Dallas-Plano-Irving, TX MD Fort Worth-Arlington, TX MD Houston-Sugar Land-Baytown, TX MSA Killeen-Temple-Fort Hood, TX MSA 1,246 645 685 619 917 919 1,084 796 1,296 1,038 1,234 526 594 528 616 529 507 1,945 1,583 1,812 1,283 1,170 1,702 El Paso, TX MSA 950 Laredo, TX MSA 264 Lubbock, TX MSA McAllen-Edinburg-Mission, TX MSA San Antonio-New Braunfels, TX MSA 396 Waco, TX MSA 188 872 975 783 1,030 728 1,434 1,252 0 500 1,000 1,500 2,000 2,500 Number of New Loans per 10,000 Adults *Note: Numbers in the ‘all’ category reflect weighted average new loans per 10,000 adults across all 16 MSAs/MDs. 5 Number of Refinances per 10,000 Adults (2012, 2017) 2012 2017 All* 644 2,001 Amarillo, TX MSA 54 Austin-Round Rock-San Marcos, TX MSA 280 Beaumont-Port Arthur, TX MSA Brownsville-Harlingen, TX MSA College Station-Bryan, TX MSA 80 Corpus Christi, TX MSA 383 Dallas-Plano-Irving, TX MD El Paso, TX MSA Fort Worth-Arlington, TX MD 1,442 1,272 868 933 1,264 790 600 908 977 1,905 2,486 2,360 2,273 2,144 2,183 1,951 2,865 Houston-Sugar Land-Baytown, TX MSA Killeen-Temple-Fort Hood, TX MSA 500 Laredo, TX MSA Lubbock, TX MSA McAllen-Edinburg-Mission, TX MSA San Antonio-New Braunfels, TX MSA Waco, TX MSA 533 379 1,582 1,238 712 1,066 1,752 2,039 2,390 2,110 0 500 1,000 1,500 2,000 2,500 3,000 3,500 Number of Refinances per 10,000 Adults *Note: Numbers in the ‘all’ category reflect weighted average number of refinances per 10,000 adults across all 16 MSAs/MDs. 6 Number of Vehicle Repossessions per 10,000 Adults (2012, 2017) 2012 2017 12 9 8 All* Amarillo, TX MSA Austin-Round Rock-San Marcos, TX MSA Beaumont-Port Arthur, TX MSA Brownsville-Harlingen, TX MSA College Station-Bryan, TX MSA 4 17 16 24 27 20 20 16 15 14 12 14 19 19 19 22 24 26 17 14 16 16 21 17 19 14 15 13 19 Corpus Christi, TX MSA Dallas-Plano-Irving, TX MD El Paso, TX MSA Fort Worth-Arlington, TX MD Houston-Sugar Land-Baytown, TX MSA Killeen-Temple-Fort Hood, TX MSA Laredo, TX MSA Lubbock, TX MSA McAllen-Edinburg-Mission, TX MSA San Antonio-New Braunfels, TX MSA Waco, TX MSA 7 0 5 10 15 20 25 30 35 40 45 Number of Vehicle Repossessions per 10,000 Adults 38 *Note: Numbers in the ‘all’ category reflect weighted median vehicle repossessions per 10,000 adults across all 16 MSAs/MDs. 7 Additionally, results found that from 2012 to 2017 there was a statistically significant decrease in the total dollar amount of new loans, and the total dollar amount of refinances. However, there was no statistically significant change in the total dollar amount of fees from 2012 to 2017. Dollar Amount of New Loans per 10,000 Adults (2012, 2017) 2012 2017 All* $430,981 $729,682 Amarillo, TX MSA $141,687 Austin-Round Rock-San Marcos, TX MSA $258,628 $522,498 $530,904 $617,079 $458,038 $511,713 $699,927 College Station-Bryan, TX MSA $193,532 $382,342 $312,721 $704,385 $1,192,208 El Paso, TX MSA $391,086 Beaumont-Port Arthur, TX MSA Brownsville-Harlingen, TX MSA Corpus Christi, TX MSA Dallas-Plano-Irving, TX MD Fort Worth-Arlington, TX MD Houston-Sugar Land-Baytown, TX MSA Killeen-Temple-Fort Hood, TX MSA Laredo, TX MSA Lubbock, TX MSA McAllen-Edinburg-Mission, TX MSA San Antonio-New Braunfels, TX MSA Waco, TX MSA $847,509 $899,490 $707,993 $821,100 $900,304 $1,084,608 $434,918 $319,819 $553,864 $643,741 $418,101 $572,429 $612,138 $526,099 $397,547 $332,571 $690,402 $891,241 8 $0 $300,000 $600,000 $900,000 $1,200,000 Dollar Amount of New Loans per 10,000 Adults *Note: Numbers in the ‘all’ category reflect weighted average dollar amount of new loans per 10,000 adults across all 16 MSAs/MDs. Dollar Amount Refinanced per 10,000 Adults (2012, 2017) 2012 2017 All* $557,937 $1,242,181 Amarillo, TX MSA $139,726 Austin-Round Rock-San Marcos, TX MSA $304,549 $868,933 $799,414 Beaumont-Port Arthur, TX MSA Brownsville-Harlingen, TX MSA College Station-Bryan, TX MSA $89,410 Corpus Christi, TX MSA $353,216 Dallas-Plano-Irving, TX MD $595,340 $1,182,285 $668,474 $750,072 $1,405,242 $1,503,244 $873,542 $1,337,692 $1,403,969 El Paso, TX MSA $638,224 Fort Worth-Arlington, TX MD Houston-Sugar Land-Baytown, TX MSA $889,271 $868,389 $1,433,153 $1,866,414 Killeen-Temple-Fort Hood, TX MSA $427,262 Laredo, TX MSA Lubbock, TX MSA McAllen-Edinburg-Mission, TX MSA San Antonio-New Braunfels, TX MSA $1,211,071 $947,232 $960,792 $1,101,492 $1,198,512 $618,372 $716,089 $544,695 $1,474,676 $1,391,490 Waco, TX MSA $239,645 $0 $400,000 $800,000 $1,200,000 $1,600,000 $2,000,000 Dollar Amount Refinanced per 10,000 Adults *Note: Numbers in the ‘all’ category reflect weighted median dollar amount refinanced per 10,000 adults across all 16 MSAs/MDs. 9 Dollar Amount of Fees per 10,000 Adults (2012, 2017) 2012 2017 All* $537,337 $470,812 Amarillo, TX MSA $106,148 $423,301 Austin-Round Rock-San Marcos, TX MSA $372,824 $358,202 El Paso, TX MSA $328,452 $612,571 Beaumont-Port Arthur, TX MSA Brownsville-Harlingen, TX MSA College Station-Bryan, TX MSA Corpus Christi, TX MSA Dallas-Plano-Irving, TX MD Fort Worth-Arlington, TX MD Houston-Sugar Land-Baytown, TX MSA Killeen-Temple-Fort Hood, TX MSA Laredo, TX MSA Lubbock, TX MSA McAllen-Edinburg-Mission, TX MSA San Antonio-New Braunfels, TX MSA Waco, TX MSA $500,151 $539,611 $528,275 $585,614 $306,464 $281,260 $556,421 $384,658 $724,022 $674,353 $706,207 $698,223 $637,252 $481,721 $624,627 $300,060 $370,650 $822,522 $496,296 $431,795 $445,847 $598,920 $493,280 $679,562 $612,925 $448,175 $0 $200,000 $400,000 $600,000 $800,000 $1,000,000 Dollar Amount of Fees per 10,000 Adults *Note: Numbers in the ‘all’ category reflect weighted average dollar amount of fees per 10,000 adults across all 16 MSAs/MDs. 10 In order to assess the specific impact of the unified ordinance, a series of mixed-effects models were conducted for each outcome type.3 These models estimated the impact of the unified ordinance on each outcome type, while controlling for effects of time and variations between MSAs/MDs. Results found that as the proportion of lenders that fall under the unified ordinance increases, there is a statistically significant decrease in the total number of new loans, total number of refinances, total number of repossessions, dollar amount of new loans, and dollar amount of fees.4 Importantly, however, there was no significant effect of the unified ordinance on the total number of borrowers. The following charts reflect the impact of the unified ordinance over time, with estimates of the impact of the unified ordinance in the following three scenarios: if there were no unified ordinance; if 50% of payday and auto title loan licensee locations were regulated by the unified ordinance; and if 100% of payday and auto title loan licensee locations were regulated by the unified ordinance. Effect of Unified Ordinance: Total Number of New Loans per 10,000 Adults (2012-2017) No Ordinance 50% ordinance 100% ordinance 1,314 1,220 1,126 1,095 1,001 906 765 671 577 1,400 1,200 1,000 800 600 400 200 0 s t l u d A 0 0 0 , 0 1 r e p s n a o L w e N f o r e b m u N 2012 2017 2014 Year For the total number of new loans, a 1% increase in licensed payday or auto title loan locations that fall under the unified ordinance was associated with a decrease of 2 new loans per 10,000 adults, controlling for the effects of time. In 2017, if there were 100% adoption of the unified ordinance, this would amount to 188 fewer new loans per 10,000 adults than having no unified ordinance in place. 11 Effect of Unified Ordinance: Total Number of Refinances per 10,000 Adults (2012-2017) No Ordinance 50% ordinance 100% ordinance 1,992 1,686 1,380 1,567 1,261 954 2012 2014 Year 929 623 317 2017 For the total number of refinances, a 1% increase in licensed payday or auto title loan locations that fall under the unified ordinance was associated with a decrease of 6 refinances per 10,000 adults, controlling for the effects of time. In 2017, if there were 100% adoption of the unified ordinance, this would amount to 612 fewer refinances per 10,000 adults than having no unified ordinance in place. Effect of Unified Ordinance: Number of Vehicle Repossessions per 10,000 Adults (2012-2017) No Ordinance 50% ordinance 100% ordinance 21 18 14 21 17 14 21 17 13 2012 2017 2014 Year For the total number of repossessions, a 1% increase in licensed payday or auto title loan locations that fall under the unified ordinance was associated with a decrease of 0.07 vehicle repossessions per 10,000 adults, controlling for the effects of time. In 2017, if there were 100% adoption of the unified ordinance, this would amount to 7 fewer vehicle repossessions per 10,000 adults than having no unified ordinance in place. 12 2,500 2,000 1,500 1,000 500 0 s t l u d A 0 0 0 0 , 0 1 r e p s e c n a n fi e R f o r e b m u N 0 0 0 , i 0 1 r e p s n o s s e s s o p e R e c h e V l i f o r e b m u N s t l u d A 25 20 15 10 5 0 Effect of Unified Ordinance: Dollar Amount of New Loans per 10,000 Adults (2012-2017) No Ordinance 50% ordinance 100% ordinance $771,938 $698,260 $624,583 $669,218 $595,541 $521,863 $515,139 $441,461 $367,784 2012 2017 2014 Year For the total dollar amount of new loans, a 1% increase in licensed payday or auto title loan locations that fall under the unified ordinance was associated with a decrease of $1,473.55 in new loans per 10,000 adults, controlling for the effects of time. In 2017, if there were 100% adoption of the unified ordinance, this would amount to a difference of $147,355 in new loans per 10,000 adults than having no unified ordinance in place. Effect of Unified Ordinance: Dollar Amount of Fees per 10,000 Adults (2012-2017) No Ordinance 50% ordinance 100% ordinance $590,847 $525,890 $460,933 $592,747 $527,790 $462,833 $595,596 $530,639 $465,682 0 0 0 , 0 1 r e p s n a o L w e N f o t n u o m A r a l l o D s t l u d A 0 0 0 , 0 1 r e p s e e F f o t n u o m A r a l l o D s t l u d A $900,000 $800,000 $700,000 $600,000 $500,000 $400,000 $300,000 $200,000 $100,000 $0 $700,000 $600,000 $500,000 $400,000 $300,000 $200,000 $100,000 $0 2012 2017 2014 Year For the total dollar amount of fees, a 1% increase in licensed payday or auto title loan locations that fall under the unified ordinance was associated with a decrease of $1,299.14 fees per 10,000 adults, controlling for the effects of time. In 2017, if there were 100% adoption of the unified ordinance, this would amount to a difference of $129,914 in fees paid per 10,000 adults than having no unified ordinance in place. 13 Conclusions Overall, results from these analyses suggest that the unified ordinance has had a meaningful positive impact for borrowers. The unified ordinance is associated with fewer negative impacts of payday and auto title loans, such as fewer refinances, fewer new loans, fewer vehicle repossessions, and a lower dollar amount of new loans and fees. State and national data indicate that re-borrowing, driven by unaffordable loans, is harmful to borrowers.5 While there has been a statistically significant decrease in the total number of borrowers from 2012 to 2017, our mixed effects models show that this decrease is not associated with the unified ordinance, suggesting that other factors, such as local economic conditions, might explain the decrease. Based on this finding, the data indicate that borrowers who desire access to payday and auto title loans continue to have that access under the unified ordinance. The market demand for short-term small dollar credit supports additional policy action, beyond expanding the ordinances to apply statewide. Statewide rate and fee caps that are consistent with fair lending standards and policies that encourage low-cost small dollar loans are important additional policy steps to support financial well-being of Texans. Policy Recommendations Implement broadly applicable standards that ensure payday and auto title loans are affordable to borrowers. Adopt statewide rate and fee caps that are consistent with fair lending standards. Support low-cost small dollar loans. 1 The 18 and older population was selected because that is the population that could potentially take out a payday or auto title loan. Population data was pulled from the U.S. Census Bureau American Community Survey, 5-year estimates for 2012, 2013, 2014, 2015, 2016, and 2017. 2 See Appendix for a detailed explanation of the statistical models and analyses used. 3 Id. 4 The model for amount refinanced failed to converge and thus is not included. See Appendix for a detailed explanation. 5 See Texas Appleseed’s report, Payday and Auto Title Lending in Texas: Market Overview and Trends 2012-2015, which found that the bulk of single payment payday loans was borne by individuals with 5 or more refinances. Available at: https://www.texasappleseed.org/sites/default/files/Payday-Auto-Title-Lending-Tx_MktOv-Trends2012-2015Rev.pdf. See the Consumer Financial Protection Bureau’s white paper, Payday Loans and Deposit Advance Products, for a similar discussion at the national level. Available at: https://files.consumerfinance.gov/f/201304_cfpb_payday-dap-whitepaper.pdf Texas Appleseed | 1609 Shoal Creek Blvd, Suite 201, Austin, TX 78701 | www.TexasAppleseed.o Report Authors: D r. Ellen Stone, Director of Research Ann Baddour, Director of Fair Financial Services estone@texasappleseed.net abaddour@texasappleseed.net www.TexasAppleseed.org Appendix Definitions The terms below are defined based on guidance from the Texas Office of Consumer Credit Commissioner and the Texas Finance Code. The data used in this study, for each variable, reflect combined data of all single payment payday loan, single payment auto title loan, installment payday loan, and installment auto title loan borrowers and transactions. The Texas Office of Consumer Credit Commissioner defines single payment loans as loans where the entire amount owed (i.e., fees, principal, and interest) are due in one scheduled payment, whereas installment loans include any other scenario, including single balloon payments of principal and interest with prior fee payments scheduled. Credit Access Business: A credit services organization that obtains for a consumer or assists a consumer in obtaining an extension of consumer credit in the form of a deferred presentment transaction (i.e., payday loan) or a motor vehicle title loan. (Sec. 393.601, Texas Finance Code). Payday and auto title loan stores in Texas operate as licensed credit access businesses. Borrowers: The number of individual consumers unique to each store, and product category that obtained a loan in the reporting year. A borrower can only be counted once per product category per year regardless of how many loans in each category they obtained. Refinance: Any transaction a Credit Access Business assists a consumer in obtaining that extends the repayment period of a then-outstanding extension of consumer credit (i.e., the loan) beyond its original term. A refinance shall include both a traditional refinance that is evidenced by a new written loan agreement with new disclosures that satisfies and replaces the prior loan agreement, as well as a renewal of a single-installment transaction in which the term of the transaction is extended for an additional like-period without the necessity of new documentation or disclosures. A refinance shall not include a workout agreement. "Refinance" includes the terms "renewal" and "rollover." New Loans: New loans are defined as a loan that is not refinanced or a renewed transaction. Borrowers can have more than one new loan in each reporting year. 15 Testing Changes from 2012 to 2017 In order to test whether there was any change in outcomes from 2012 to 2017, a series of paired sample t-tests were conducted on: the weighted total number of borrowers, the weighted total number of new loans, the weighted total number of refinances, the weighted dollar amount of new loans, the weighted dollar amount of refinances, the weighted dollar amount of fees, and the weighted total number of vehicle repossessions. The distributions for weighted total borrowers and weighted total vehicle repossessions were found to have violated assumptions of normality. Therefore, Wilcoxon signed rank tests were performed on weighted total borrowers and weighted total vehicle repossessions. All other variables had normal distributions. Results Number of Borrowers. There was a significant decrease in the weighted total number of borrowers from 2012 (Mdn = 809) to 2017 (Mdn=434), V = 135, p < .001, r = .87. Number of New Loans. There was a significant decrease in the weighted total number of new loans from 2012 (M = 1,246, SD = 374) to 2017 (M =645, SD =265), t(15) = 7.34, p <.001, d = 1.83. Number of Refinances. There was a significant decrease in the weighted total number of refinances from 2012 (M =2,001, SD =450) to 2017 (M =644, SD =351), t(15) =12.58, p <.001, d = 3.14. Dollar Amount of New Loans. There was a significant decrease in the weighted total dollar amount of new loans from 2012 (M = $739,682, SD =$219,179) to 2017 (M =$430,981, SD =$186,277), t(15) = 6.84, p <.001, d = 1.71. Dollar Amount of Refinances. There was a significant decrease in the weighted total dollar amount of refinances from 2012 (M = $1,242,181, SD =$297,019) to 2017 (M =$557,937, SD =$275,183), t(15) = 9.37, p <.001, d = 2.34. Dollar Amount of Fees. There was no significant decrease in the weighted total dollar amount of fees from 2012 (M =$537,337, SD =$127,962) to 2017 (M =$470,812, SD = $181,156), t(15) = 1.36, p =.10. Number of Vehicle Repossessions. There was a significant decrease in the weighted total number of vehicle repossessions from 2012 (Mdn = 16.94) to 2017 (Mdn = 15.67), V = 101, p =.05, r = .43. 16 Testing the Impact of the Unified Ordinance A series of multi level models were conducted in order to test the specific impact of the unified ordinance on each outcome variable, while controlling for time. Multi level models were used because each MSA/MD had repeated measures for each year. In order to assess the impact of the ordinance, we created a variable that captured the proportion of licensed payday or auto title loan locations that would full under the ordinance for each MSA/MD, based on a list of licensed locations by address for each year included in the study. The proportion ordinance variable was measured on a scale of 0%-100% of locations in the MSA/MD that were regulated by the unified ordinance. For each outcome variable, models were fit according to the following taxonomy: Model A was an unconditional means model, Model B was an unconditional growth model (i.e., included the effect of time), and Model C included the proportion of the unified ordinance as a predictor of each outcome variable. For each of the outcome variables, there was a significant improvement in model fit for Model C. As such, Model C was chosen as the preferred model. However, the weighted dollar amount of refinances failed to converge on any model, thus it is not included in analyses. Model C for all outcome variables was tested across measures of linearity, homogeneity of variance, and normality of residuals and there were no violations of assumptions. Results Number Borrowers. Model C, which included the proportion of ordinance as a predictor variable, did not significantly improve model fit (χ2(1)= 3.05, p = .08), therefore there is no effect of the proportion of ordinance on the weighted total number of borrowers. Number of New Loans. The proportion of ordinance significantly affected the weighted total number of new loans (χ2(1)= 5.22, p < .05), decreasing the weighted total new loans by 1.88 loans per 10,000 adults ±0.81 standard errors (t(90)=-2.32, p < .05). Dollar Amount of New Loans. The proportion of ordinance significantly affected the weighted total dollar amount of new loans (χ2(1)= 8.94, p < .05), decreasing the weighted total dollar amount of new loans by $1,473.55 per 10,000 adults ±$481.16 standard errors (t(90)=-3.06, p < .05). 17 Dollar Amount Refinanced. The proportion of ordinance significantly affected the weighted dollar amount refinanced (χ2(1)= 19.93, p < .05), decreasing the weighted total dollar amount refinanced by $4,160.73 per 10,000 adults ±$884.05 standard errors (t(90)=-4.71, p < .05). Dollar Amount of Fees. The proportion of ordinance significantly affected the weighted total dollar amount of fees (χ2(1)=5.88 , p < .05), decreasing the weighted total dollar amount of fees by $1,299.14 per 10,000 adults ±$527.44 standard errors (t(90)=-2.46, p < .05). Number of Vehicle Repossessions. The proportion of ordinance significantly affected the weighted total number of vehicle repossessions (χ2(1)= 9.82, p < .05), decreasing the weighted total loans by 0.07 repossessions per 10,000 adults ±0.02 standard errors (t(90)=-3.23, p < .05). All analyses were conducted in R. 18 Concentration of High-Cost Financial Services by Zip Code, 2018 People of Color Population by Zip Code, 2016 In areas where bank and credit union branches equal or exceed high-cost financial services locations, similar households have a 30 percent higher rate of asset-building and higher economic mobility compared to those in banking deserts. Opening Mobility Pathways by Closing the Financial Services Gap William J. Bynum, Diana Elliott, and Edward Sivak, February 2018