03.4 - BSRB BCER Public Release Redacted 2023.12.08_Part4 — original pdf
Backup
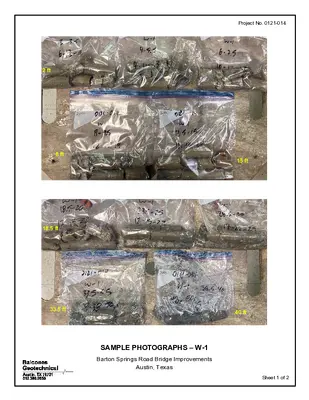
Project No. 0121-014 15 ft 2 ft 8 ft 18.5 ft 33.5 ft 40 ft SAMPLE PHOTOGRAPHS – W-1 Barton Springs Road Bridge Improvements Austin, Texas Sheet 1 of 2 40 ft – Del Rio Clayshale Project No. 0121-014 44 ft – Georgetown Limestone 45 ft 50 ft 55 ft 50 ft 60 ft SAMPLE PHOTOGRAPHS – W-1 Barton Springs Road Bridge Improvements Austin, Texas Sheet 2 of 2 Project No. 0121-014 15 ft 2 ft 7 ft 18.5 ft 33.5 ft 39 ft SAMPLE PHOTOGRAPHS – W-2 Barton Springs Road Bridge Improvements Austin, Texas Sheet 1 of 2 40 ft – Del Rio Clayshale 41.5 ft – Georgetown LS Project No. 0121-014 45 ft 55 ft 50 ft SAMPLE PHOTOGRAPHS – W-2 Barton Springs Road Bridge Improvements Austin, Texas 50 ft 60 ft Sheet 2 of 2 1 ft 7 ft 18.5 ft 28.5 ft Project No. 0121-014 15 ft 34.3 ft SAMPLE PHOTOGRAPHS – W-3 Barton Springs Road Bridge Improvements Austin, Texas Sheet 1 of 2 35 ft – Del Rio Clayshale Project No. 0121-014 39 ft – Georgetown Limestone 40 ft 45 ft 45 ft 50 ft SAMPLE PHOTOGRAPHS – W-3 Barton Springs Road Bridge Improvements Austin, Texas Sheet 2 of 2 0 ft 6 ft – Buda Limestone Project No. 0121-014 5.5 ft 10 ft SAMPLE PHOTOGRAPHS – W-4 Barton Springs Road Bridge Improvements Austin, Texas Sheet 1 of 6 10 ft 20 ft Project No. 0121-014 15 ft 20 ft 23 ft – Del Rio Clayshale 25 ft SAMPLE PHOTOGRAPHS – W-4 Barton Springs Road Bridge Improvements Austin, Texas 30 ft Sheet 2 of 6 30 ft 40 ft 35 ft 45 ft Project No. 0121-014 40 ft 50 ft SAMPLE PHOTOGRAPHS – W-4 Barton Springs Road Bridge Improvements Austin, Texas Sheet 3 of 6 Project No. 0121-014 55 ft 60 ft 50 ft 60 ft Core loss due to core barrel jam - 65 to 70 ft 65 ft 70 ft SAMPLE PHOTOGRAPHS – W-4 Barton Springs Road Bridge Improvements Austin, Texas Sheet 4 of 6 Core loss due to core barrel jam - 70 to 72 ft 70 ft Project No. 0121-014 75 ft 80 ft 80 ft – Georgetown Limestone 85 ft SAMPLE PHOTOGRAPHS – W-4 Barton Springs Road Bridge Improvements Austin, Texas 90 ft Sheet 5 of 6 Project No. 0121-014 95 ft 100 ft 90 ft 100 ft 105 ft SAMPLE PHOTOGRAPHS – W-4 Barton Springs Road Bridge Improvements Austin, Texas Sheet 6 of 6 Project No. 0121-014 1 ft 4.5 ft 6.5 ft – Buda Limestone 10 ft SAMPLE PHOTOGRAPHS – W-5 Barton Springs Road Bridge Improvements Austin, Texas Sheet 1 of 6 10 ft Project No. 0121-014 15 ft 18.2 ft – Del Rio Clayshale 20 ft 20 ft 25 ft 30 ft SAMPLE PHOTOGRAPHS – W-5 Barton Springs Road Bridge Improvements Austin, Texas Sheet 2 of 6 Project No. 0121-014 30 ft 40 ft 35 ft 40 ft 45 ft SAMPLE PHOTOGRAPHS – W-5 Barton Springs Road Bridge Improvements Austin, Texas 50 ft Sheet 3 of 6 50 ft 60 ft Project No. 0121-014 55 ft 65 ft 60 ft 70 ft SAMPLE PHOTOGRAPHS – W-5 Barton Springs Road Bridge Improvements Austin, Texas Sheet 4 of 6 70 ft 80 ft Project No. 0121-014 75 ft 80 ft 85 ft – Georgetown Limestone SAMPLE PHOTOGRAPHS – W-5 Barton Springs Road Bridge Improvements Austin, Texas 90 ft Sheet 5 of 6 90 ft 100 ft 95 ft 105 ft Project No. 0121-014 100 ft 110 ft SAMPLE PHOTOGRAPHS – W-5 Barton Springs Road Bridge Improvements Austin, Texas Sheet 6 of 6 APPENDIX A-2 (Previous Studies) Arias Boring Logs B-1, B-2, and B-4, and Core Photographs (2018) Keys to Terms and Symbols Fugro Plan of Borings (1999) Fugro Boring Log B-1 Keys to Terms and Symbols B-1 45 ft 55 ft 50 ft 59 ft 50 ft 59 ft 60 ft B-2 35 ft 30 ft 35 ft 45 ft 45 ft 55 ft B-2 55 ft 60 ft 49 ft 58 ft 49 ft 58 ft B-4 45 ft 65 ft KEY TO TERMS AND SYMBOLS USED ON BORING LOGS TABLE 1 Soil Classification Chart (ASTM D 2487-11) Soil Classification Group Symbol GW Group Name B E Well-Graded Gravel GP GM GC SW SP SM SC CL ML OL CH MH OH PT E Poorly-Graded Gravel Silty Gravel E F G Clayey Gravel E F G Well-Graded Sand Poorly-Graded Sand I I Silty Sand F G I Clayey Sand F G I Lean Clay K L M K L M Silt K L M N Organic Clay Organi Silt Fat Clay K L M O K L M Elastic Silt K L M K L M P K L M Q Organic Clay Organic Silt Peat Criteria of Assigning Group Symbols and Group Names Using Laboratory Tests A COARSE-GRAINED SOILS More than 50% retained on No. 200 sieve Gravels (More than 50% of coarse fraction retained on No. 4 sieve) Clean Gravels (Less than 5% fines C ) Gravels with Fines (More than 12% fines C ) Sands (50% or more of coarse fraction passes No. 4 sieve) Clean Sands (Less than 5% fines H ) Sands with Fines (More than 12% fines H ) Cu ≥ 4 and 1 ≤ Cc ≤ 3 D Cu < 4 and/or D [Cc < 1 or Cc > 3] Fines classify as ML or MH Fines classify as CL or CH D Cu ≥ 6 and 1 ≤ Cc ≤ 3 Cu < 6 and/or D [Cc < 1 or Cc > 3] Fines classify as ML or MH FINE-GRAINED SOILS Silts and Clays inorganic Liquid limit less than 50 organic 50% or more passes the No. 200 sieve Silts and Clays inorganic Liquid limit 50 or more organic Fines classify as CL or CH PI > 7 and plots on or above "A" line PI < 4 or plots below "A" line J J <0.75 Liquid limit - oven dried Liquid limit - not dried PI plots on or above "A" line PI plots on or below "A" line Liquid limit - oven dried Liquid limit - not dried <0.75 HIGHLY ORGANIC SOILS Primarily organic matter, dark in color, and organic odor A Based on the material passing the 3-inch (75mm) sieve B If field sample contained cobbles or boulders, or bo h, add "with cobbles or boulders, or both" to group name C Gravels wi h 5% to 12% fines require dual symbols: GW-GM well-graded gravel with silt GW-GC well-graded gravel with clay GP-GM poorly-graded gravel with silt GP-GC poorly-graded gravel wi h clay D Cu = D60/D10 Cc = (D30)2 D10 x D60 E If soil contains ≥ 15% sand, add "with sand" to group name F If fines classify as CL-ML, use dual symbol GC-GM, or SC-SM G If fines are organic, add "with organic fines" to group name H Sand with 5% to 12% fines require dual symbols: SW-SM well-graded sand with silt SW-SC well-graded sand with clay SP-SM poorly-graded sand with silt SP-SC poorly-graded sand with clay I If soil contains ≥ 15% gravel, add "with gravel" to group name J If Atterberg limits plot in hatched area, soil is a CL-ML, silty clay K If soil contains 15% to < 30% plus No. 200, add "with sand" or "with gravel," whichever is predominant L If soil contains ≥ 30% plus No. 200, predominantly sand, add "sandy" to group name M If soil contains ≥ 30% plus No. 200, predominantly gravel, add "gravelly" to group name N PI ≥ 4 and plots on or above "A" line O PI < 4 or plots below "A" line P PI plots on or above "A" line Q PI plots below "A" line TERMINOLOGY Boulders Cobbles Gravel Sand Silt or Clay Calcareous Stratified Laminated Fissured Slickensided Blocky Lensed Homogeneous Over 12-inches (300mm) 12-inches to 3-inches (300mm to 75mm) 3-inches to No. 4 sieve (75mm to 4.75mm) No. 4 sieve to No. 200 sieve (4.75mm to 0.075mm) Passing No. 200 sieve (0.075mm) Containing appreciable quantities of calcium carbonate, generally nodular Parting Seam Layer Inclusion < 1/8-inch thick extending through samples Inclusion 1/8-inch to 3-inches thick extending through sample Inclusion > 3-inches thick extending through sample Alternating layers of varying material or color with layers at least 6mm thick Alternating layers of varying material or color with the layers less than 6mm thick Breaks along definite planes of fracture with little resistance to fracturing Fracture planes appear polished or glossy sometimes striated Cohesive soil that can be broken down into small angular lumps which resist further breakdown Inclusion of small pockets of different soils, such as small lenses of sand scattered through a mass of clay Same color and appearance throughout Arias Geoprofessionals KEY TO TERMS AND SYMBOLS USED ON BORING LOGS Hardness Classification of Intact Rock Class Hardness Field Test Approximate Range of Uniaxial Compression Strength kg/cm² (tons/ft²) I II III IV V Extremely hard Many blows with geologic hammer required to break intact specimen. > 2,000 Very hard Hand held specimen breaks with hammer end of pick under more than one blow. Hard Soft Cannot be scraped or pealed with knife, hand held specimen can be broken wi h single moderate blow with pick. Can just be scraped or peeled with knife. Indentations 1mm to 3mm show in specimen with moderate blow with pick. Very soft Material crumbles under moderate blow with sharp end of pick and can be peeled with a knife, but is too hard to hand-trim for triaxial test specimen. 2,000 – 1,000 1,000 – 500 500 – 250 250 – 10 Grade Fresh Slightly Weathered Moderately Weathered Highly Wea hered Completely Weathered Residual Soil Rock Weathering Classifications Symbol Diagnostic Features F WS WM WH WC RS No visible sign of Decomposition or discoloration. Rings under hammer impact. Slight discoloration inwards from open fractures, otherwise similar to F. Discoloration throughout. Weaker minerals such as feldspar decomposed. Strength somewhat less than fresh rock, but cores cannot be broken by hand or scraped by knife. Texture preserved. Most minerals somewhat decomposed. Specimens can be broken by hand with effort or shaved with knife. Core stones present in rock mass. Texture becoming indistinct, but fabric preserved. Minerals decomposed to soil, but fabric and structure preserved (Saprolite). Specimens easily crumbled or penetrated. Advanced state of decomposition resulting in plas ic soils. Rock fabric and structure completely destroyed. Large volume change. Description for Structural Features: Bedding, Foliation, or Flow Banding Spacing Description for Joints, Faults or Other Fractures Very thickly (bedded, foliated, or banded) More than 6 feet Very widely (fractured or jointed) Rock Discontinuity Spacing Thickly Medium Thinly Very thinly 2 – 6 feet 8 – 24 inches 2½ – 8 inches ¾ – 2½ inches Widely Medium Closely Very closely Description for Micro-Structural Features: Lamination, Foliation, or Cleavage Spacing Descriptions for Joints, Faults, or Other Fractures Intensely (laminated, foliated, or cleaved) ¼ – ¾ inch Extremely close Very intensely Less than ¼ inch RQD % 90 – 100 75 – 90 50 – 75 25 – 50 0 – 25 Engineering Classification for in Situ Rock Quality Velocity Index Rock Mass Quality 0.80 – 1.00 0.60 – 0.80 0.40 – 0.60 0.20 – 0.40 0 – 0.20 Excellent Good Fair Poor Very Poor Arias Geoprofessionals APPENDIX B – LABORATORY TEST RESULTS Summary of Laboratory Test Results Balcones Project No. 0121-014 BARTON SPRINGS ROAD BRIDGE — BRIDGE AND ROADWAY IMPROVEMENTS — SUMMARY OF LABORATORY TEST RESULTS Boring No. Top Depth (ft) Bottom Depth (ft) Test Assign- ment Boring Type Geologic Formation USCS Soil Class- ification Natural Moisture Content (%) Gravel Liquid Limit (%) Plastic Limit (%) Plast- icity Index (%) (<3" and >#4) Sand (%) (<#4 and >#200) Fines (%) (<#200) % Passing No. 4 Sieve % Passing No. 40 Sieve % Passing No. 200 Sieve (UDW) Unit Dry Weight (pcf) Compress- ive Strength qu (tsf) Shear Strength su (tsf) Compress- ive Strength, qu (tsf) Shear Strength su (tsf) Confining Pressure (psi) Max Swell Pressure (psf) Void Ratio eo Max Swell (%) Atterberg Limits Sieve Analysis (UC) Unconfined Compressive Strength (UU) Triaxial Unconsolidated- Undrained Compressive Strength Pressure Swell Triaxial CU (3 points) Effective Friction Angle ϕ' (deg) Effective Cohesion Intercept, c' (psi) Direct Shear Analytical Effective Cohesion Intercept, c' (psi) Effective Friction Angle ϕ' (deg) Chloride (ppm) Sulfate (ppm) pH Resist- ivity (Ω/cm) T-1 T-2 T-3 T-4 T-5 3 20 30 42 53 1 5 15 25 37 47 4 8 15 25 30 37 47 57 4 5 21.5 31.5 43 54 2.5 6.5 16.5 26.5 38 48 5.5 9.5 16.5 26.5 31.5 38 48 58 5.5 13.5 14.5 17 27 34 39 3 5 7 5 16 25 34 18 28 35 40 5 9 17 26 35 AL, Sieve Sieve UC rock AL, Sieve Sieve UC rock AL, Sieve Sieve UC rock AL, Sieve UC rock AL, Sieve UC rock Bridge /Trail Slope Stabili- zation Bridge /Trail Slope Stabili- zation Bridge /Trail Slope Stabili- zation Bridge /Trail Slope Stabili- zation Bridge /Trail Slope Stabili- zation CL CL GP SC CL CL SP-SC CL CL CL SC SP GC CL Alluvium Georgetown Limestone Alluvium Georgetown Limestone Alluvium Georgetown Limestone Alluvium Del Rio Clay Georgetown Limestone Alluvium Del Rio Clay GC CH Georgetown Limestone 18 28 9 3 4 6 13 15 10 4 4 13 13 20 11 15 5 3 4 7 14 4 3 3 4 10 19 5 3 4 33 48 27 38 29 36 35 30 17 18 16 16 16 18 17 19 16 30 11 22 13 18 18 11 32 36 15 15 17 21 0 0 66 24 4 0 41 2 0 0 26 24 48 0 34 52 15 20 19 32 35 3 40 22 30 34 27 18 52 15 36 28 49 73 32 13 30 10 60 78 4 42 69 82 7 83 64 72 25 3 20 87 35 87 100 100 34 76 96 100 59 98 100 100 74 76 52 100 65 97 97 99 13 62 89 99 13 97 96 98 36 11 30 97 44 91 60 78 4 42 69 82 7 83 64 72 25 3 20 87 35 87 155 150 260 116 130 58 151 152 109 199 55 100 148 156 153 159 156 154 153 146 156 150 281 212 188 165 320 217 86 347 539 106 141 106 94 83 160 109 43 174 270 53 Page 1 of 4 Balcones Project No. 0121-014 BARTON SPRINGS ROAD BRIDGE — BRIDGE AND ROADWAY IMPROVEMENTS — SUMMARY OF LABORATORY TEST RESULTS Boring No. Top Depth (ft) Bottom Depth (ft) Test Assign- ment Boring Type Geologic Formation USCS Soil Class- ification Natural Moisture Content (%) Gravel Liquid Limit (%) Plastic Limit (%) Plast- icity Index (%) (<3" and >#4) Sand (%) (<#4 and >#200) Fines (%) (<#200) % Passing No. 4 Sieve % Passing No. 40 Sieve % Passing No. 200 Sieve (UDW) Unit Dry Weight (pcf) Compress- ive Strength qu (tsf) Shear Strength su (tsf) Compress- ive Strength, qu (tsf) Shear Strength su (tsf) Confining Pressure (psi) Max Swell Pressure (psf) Void Ratio eo Max Swell (%) Atterberg Limits Sieve Analysis (UC) Unconfined Compressive Strength (UU) Triaxial Unconsolidated- Undrained Compressive Strength Pressure Swell Triaxial CU (3 points) Effective Friction Angle ϕ' (deg) Effective Cohesion Intercept, c' (psi) Direct Shear Analytical Effective Cohesion Intercept, c' (psi) Effective Friction Angle ϕ' (deg) Chloride (ppm) Sulfate (ppm) pH Resist- ivity (Ω/cm) W-1 W-2 W-3 W-4 4 13.5 24 38.5 44 51 4 7 23.5 33.5 43 50 57 7 18.5 28.5 36 42 47 10 18 25 32 38 44 49 56 58 64 74 78 82 88 97 5.5 15 35 40 45 52 5 20 25 35 44 51 58 8.5 20 30 43 48 11 19 57 83 89 98 103 104 CH CH CH CL CH CH CH CH CH CH CH AL, Sieve AL, CU Triaxial AL, Sieve UC rock AL, Sieve AL, CU Triaxial AL, Sieve UC rock Retaining Wall Del Rio Clay Del Rio Clayshale Georgetown Limestone Retaining Wall Del Rio Clay Georgetown Limestone AL, Sieve Del Rio Clay Retaining Wall Del Rio Clayshale Georgetown Limestone Buda Limestone UU rock UC rock UC rock Analytical UU rock Direct Shear UU rock AL, Sieve, Pressure Swell Direct Shear UU rock Direct Shear UU rock UC rock Del Rio Clayshale Retaining Wall CH Georgetown Limestone 15 20 16 4 5 15 16 14 6 4 3 10 17 17 16 5 4 5 11 20 16 19 14 11 16 12 19 13 13 7 4 4 66 63 55 41 59 65 67 55 54 65 54 21 25 26 18 18 28 20 17 18 20 19 45 38 29 23 41 37 47 38 36 45 35 3 0 0 3 1 1 3 0 4 8 5 8 7 6 5 20 9 13 89 95 97 100 92 97 89 95 92 100 97 92 90 97 93 90 93 94 77 91 83 99 99 97 100 96 95 97 83 95 89 93 94 77 91 83 70 71 34 78 60 58 142 21 3 151 149 139 141 67 155 120 116 283 42 6 147 151 154 118 147 152 146 131 109 109 122 56 22 34 0 1 99 100 100 99 121 122 123 125 143 151 151 30 68 343 126 15 34 172 63 2.8 18.9 2.7 18.6 6 3 18 3 3 16 3 9 2 2 8 1 5 15 15 25 30 35 150 7600 6.59 3.80E+02 340 0.418 1.3% 25.5 13.1 3.1 4.5 14 9 24 2 Page 2 of 4 Balcones Project No. 0121-014 Boring No. Top Depth (ft) Bottom Depth (ft) 9 18 26 33 37 43 47 53 59 64 69 76 84 87 92 102 3 5 13.5 28.5 48 57 59 8 5 18.5 33 39 52 59 13.5 28.5 43.5 47 57 63 10 19 27 88 93 103 5 15 30 49 58 60 10 20 34 40 53 60 15 30 44.3 48 58 64 W-5 B-1 B-2 B-4 Boring Type Geologic Formation Buda Limestone Test Assign- ment UC rock AL, Sieve UU rock Direct Shear UU rock Del Rio Clayshale Direct Shear Retaining Wall UU rock Direct Shear UU rock UC rock Georgetown Limestone AL, Sieve Alluvium Bridge UC rock AL, Sieve Bridge UC rock Georgetown Limestone Alluvium Del Rio Clay Georgetown Limestone CH CL CH SP CL CH AL, Sieve Alluvium Bridge UC rock Georgetown Limestone CL SC-SM CL BARTON SPRINGS ROAD BRIDGE — BRIDGE AND ROADWAY IMPROVEMENTS — SUMMARY OF LABORATORY TEST RESULTS Atterberg Limits Sieve Analysis (UC) Unconfined Compressive Strength (UU) Triaxial Unconsolidated- Undrained Compressive Strength Pressure Swell USCS Soil Class- ification Natural Moisture Content (%) Gravel Liquid Limit (%) Plastic Limit (%) Plast- icity Index (%) (<3" and >#4) Sand (%) (<#4 and >#200) Fines (%) (<#200) % Passing No. 4 Sieve % Passing No. 40 Sieve % Passing No. 200 Sieve (UDW) Unit Dry Weight (pcf) Compress- ive Strength qu (tsf) Shear Strength su (tsf) Compress- ive Strength, qu (tsf) Shear Strength su (tsf) Confining Pressure (psi) Max Swell Pressure (psf) Void Ratio eo Max Swell (%) Triaxial CU (3 points) Effective Friction Angle ϕ' (deg) Effective Cohesion Intercept, c' (psi) Direct Shear Analytical Effective Cohesion Intercept, c' (psi) Effective Friction Angle ϕ' (deg) Chloride (ppm) Sulfate (ppm) pH Resist- ivity (Ω/cm) 7 4 3 5 5 4 9 4 2 2 3 2 2 5 15 20 25 25 30 35 40 94.5 28.1 11.2 21.4 0.3 30 8 5 11 17 26 19 17 14 18 16 14 15 12 4 3 3 16 16 23 3 3 1 13 36 1 2 1 1 18 22 11 4 2 3 63 24 39 0 1 99 100 99 99 38 50 23 29 63 26 19 30 16 17 15 15 21 15 13 14 22 33 8 14 42 11 6 16 1 3 44 0 0 0 0 16 20 36 52 24 3 37 85 34 79 61 4 76 97 63 15 50 99 97 56 100 100 100 100 84 97 86 15 98 99 98 94 62 79 61 4 76 97 63 15 50 147 129 116 109 111 114 117 117 131 152 156 156 147 151 148 152 148 152 150 150 150 150 347 9 174 5 199 354 187 88 140 151 175 159 185 255 116 112 103 100 177 94 44 70 76 88 80 93 128 58 56 52 Page 3 of 4 Balcones Project No. 0121-014 Boring No. Top Depth (ft) Bottom Depth (ft) FB-1 22 35 38 43 49 51 57 64 73 78 84 91 94 23 36 39 44 50 52 58 65 74 79 85 92 95 Boring Type Geologic Formation Buda Limestone Del Rio Clay Retaining Wall Del Rio Clayshale Test Assign- ment UC rock AL, Sieve, UU rock UC rock AL UC rock Georgetown Limestone BARTON SPRINGS ROAD BRIDGE — BRIDGE AND ROADWAY IMPROVEMENTS — SUMMARY OF LABORATORY TEST RESULTS Atterberg Limits Sieve Analysis (UC) Unconfined Compressive Strength (UU) Triaxial Unconsolidated- Undrained Compressive Strength Pressure Swell USCS Soil Class- ification Natural Moisture Content (%) Gravel Liquid Limit (%) Plastic Limit (%) Plast- icity Index (%) (<3" and >#4) Sand (%) (<#4 and >#200) Fines (%) (<#200) % Passing No. 4 Sieve % Passing No. 40 Sieve % Passing No. 200 Sieve (UDW) Unit Dry Weight (pcf) Compress- ive Strength qu (tsf) Shear Strength su (tsf) Compress- ive Strength, qu (tsf) Shear Strength su (tsf) Confining Pressure (psi) Max Swell Pressure (psf) Void Ratio eo Max Swell (%) Triaxial CU (3 points) Effective Friction Angle ϕ' (deg) Effective Cohesion Intercept, c' (psi) Direct Shear Analytical Effective Cohesion Intercept, c' (psi) Effective Friction Angle ϕ' (deg) Chloride (ppm) Sulfate (ppm) pH Resist- ivity (Ω/cm) 55 67 22 23 33 44 59 20 39 1 19 18 16 14 12 16 14 13 12 11 4 5 79 92 90 162 112 123 115 126 117 118 125 126 130 153 150 259 130 7 8 3 4 15 18 13 15 14 15 12 18 27 359 223 7 8 7 8 6 9 14 180 112 Page 4 of 4 Natural Water Content (ASTM D 2216) Natural water content tests were performed on samples in which classification and/or strength tests were performed. Each sample was visually classified in the laboratory. Natural water contents are tabulated at sample depth on the boring logs. Atterberg Limits (ASTM D 4318) Atterberg limit tests are classification tests that determine the liquid limit and plastic limit of the soil fraction finer than the No. 40 sieve. The Atterberg limits are approximate water contents at which the soil tested behaves in a specified manner. The liquid limit is determined by measuring, in a standard device, the water content and number of blows required to close a specific width groove cut in a remolded soil sample a specified length. The plastic limit is determined by measuring the water content when threads of soil 1/8-inch in diameter begin to crumble. The plasticity index, defined as the difference between the liquid and plastic limits, indicates the degree of plasticity or the magnitude of the water content over which the soil remains plastic. Liquid limit and plasticity index values are tabulated at the sample depths on the boring logs. Atterberg Limits results are shown on the boring logs under the appropriate column at the sample test depth (Appendix A) and in the Summary of Laboratory Test Results (Appendix B). Sieve Analysis (ASTM D422) Grain-size characteristics of the natural soils were investigated by the determination of the percent of soil passing the Nos. 4, 10, 40 and 200 sieves. These tests were performed by washing or sieving material through the respective sieves. The results are presented graphically in Appendix B-1, and partial mechanical analyses consisting of percent passing the No. 4 and the No. 200 are presented on the boring logs at the respective sample depths. For two samples, a sedimentation process using a hydrometer was used to determine the distribution of particle sizes finer than the No. 200 sieve. Prior to starting the hydrometer test, sodium hexametaphosphate was added to the clay and silt sample as a dispersing agent. The diameter of a particle corresponding to the percentage indicated by a given hydrometer reading is calculated according to Stokes’ law. (UC) Unconfined Compressive Strength (ASTM D7012) Unconfined compression tests were conducted on selected intact rock samples. The compression test consists of applying an axial compression load to a laterally unsupported sample and compressing to failure. The unconfined compressive strength is the measured applied load at failure. Compressive strength results are shown on the boring logs under the appropriate column at the sample test depth (Appendix A) and in the Summary of Laboratory Test Results (Appendix B). (UU) Unconsolidated-Undrained Triaxial Compressive Strength on Shale Samples (ASTM D2850) In the unconsolidated-undrained triaxial compression test performed on rock specimens, a laterally supported cylindrical rock specimen was loaded axially in compression to failure. The test specimens were about 2 inches in diameter by 4 inches in length. A selected confining pressure is initially applied to the specimen, and then an axial load is applied to produce failure. Applied stress and axial deformation (strain) information is recorded during testing and used to determine failure. UU compressive strength results are shown on the boring logs under the appropriate column at the sample test depth (Appendix A) and in the Summary of Laboratory Test Results (Appendix B). Analytical Testing of Soil (Chloride Content ASTM D512) Summary of the test method — Dilute mercuric nitrate solution is added to an acidified sample in the presence of mixed dipheny1carbazonebromophenol blue indicator. The end point of the titration is the formation of the blue-violet mercury diphenylcarbazone complex. Use a volume of sample such that it will contain not more than 20 mg of chloride ion, diluting the sample with water to approximately 50 mL volume, if necessary. Determine an indicator blank on 50 mL of chloride-free water, applying the same procedure followed for the sample. Add 5 to 10 drops of mixed indicator solution and shake or swirl the flask. If a blue-violet or red color develops, add HNO3 (3 volumes concentrated nitric acid and 997 volumes water) dropwise until the color changes to yellow. Add 1 mL of excess acid. If a yellow or orange color forms immediately on addition of the mixed indicator, add NaOH solution (10 g/L) dropwise until the color changes to blue-violet; then add HNO3 (3 + 997) dropwise until the color changes to yellow and further add 1 mL excess of acid. Titrate the solution and a blank with 0.025 NHg(NO3H)2 solution until a blue-violet color, as viewed by transmitted light, persists throughout the solution. Record the milliliters of Hg(NO3H)2 solution added in each case. Calculate the chloride ion concentration, in milligrams per liter. Analytical Testing of Soil (Sulfate Content ASTM D516) Summary of the test method — sulfate ion is converted to a barium sulfate suspension under controlled conditions. A solution containing glycerin and sodium chloride is added to stabilize the suspension and minimize interferences. The resulting turbidity is determined by a nephelometer, spectrophotometer, or photoelectric colorimeter and compared to a curve prepared from standard sulfate solutions. Prepare a calibration curve showing sulfate ion content in milligrams per liter plotted against the corresponding photometer readings. Prepare standards by diluting with water 0.0, 2.0, 5.0, 10.0, 15.0, 20.0, 30.0, and 40.0 mL of standard sulfate solution to 100-mL volumes in volumetric flasks. These solutions will have sulfate ion concentrations of 0.0, 2.0, 5.0, 10.0, 15.0, 20.0, 30.0, and 40.0 mg/L (ppm), respectively. Filter the sample if it is turbid. Pipet into a 250-mL beaker 100 mL or less of the clear sample containing between 0.5 and 4 mg of sulfate ion (Dissolve 0.1479 g of anhydrous sodium sulfate (Na2SO4) in water and dilute with water to 1 L in a volumetric flask). Dilute to 100 mL with water if required and add 5.0 mL of conditioning reagent (30 mL of concentrated hydrochloric acid 300 mL reagent water, 100 mL 95 % ethanol or isopropanol, 75 g sodium chloride, and 50 mL glycerol and mix). Mix in the stirring apparatus. While the solution is being stirred, add a measured spoonful of BaCl2 crystals (0.3 g) and begin timing immediately. Stir exactly 1.0 min at constant speed. Immediately after the stirring period has ended, pour solution into the cell and measure the turbidity at 30-s intervals for 4 min. Record the maximum reading obtained in the 4-min period. If the sample contains color or turbidity, run a sample blank without the addition of the barium chloride. Convert the photometer readings obtained with the sample to milligrams per liter sulfate ion (SO4) by use of the calibration curve. Analytical Testing of Soil (pH ASTM G51) During the calibration procedure for the pH meter, standard buffered solutions of known pH are necessary. At least two standard buffered pH solutions that span the soil pH to be measured are required. From practical experience, standard solutions of pH 4, 7, and 8 are recommended. By the nature of the measurement, pH is determined for a small volume of soil at each reading, and it is important that at least three measurements at different locations be made and a simple average calculated. The reference electrode should be placed in contact with the soil near the glass electrode. Allow 1 or 2 min for equilibrium to be established, then take the meter reading. After approximately 1 min, repeat the meter reading. In general, the values will agree within 0.2 pH units. If the range of values is as large as 0.4, then repeat the test. Analytical Testing of Soil (Resistivity ASTM G57) Summary of the test method — The Wenner four-electrode method requires that four metal electrodes be placed with equal separation in a straight line in the surface of the soil. The resulting resistivity measurement represents the average resistivity of a hemisphere of soil of a radius equal to the electrode separation. A voltage is impressed between the outer electrodes, causing current to flow, and the voltage drop between the inner electrodes is measured using a sensitive voltmeter. The equipment required for the measurement of the resistivity of soil samples, either in the field or in the laboratory, is identical to that needed for at-grade measurements except that the electrodes are replaced with an inert container containing four permanently mounted electrodes. If the current-carrying (outside) electrodes are not spaced at the same interval as the potential- measuring (inside) electrodes, the resistivity, ρ, is: ρ, Ω·cm = π*b*R / (1 – (b/(b+a))) where: b = outer electrode spacing, cm a = inner electrode spacing, cm, and R = resistance, Ω. Soil samples should be representative of the area of interest where the stratum of interest contains a variety of soil types. It is desirable to sample each type separately. It will also be necessary to prepare a mixed sample. The sample should be reasonably large and thoroughly mixed so that it will be representative. The soil should be well-compacted in layers in the soil box, with air spaces eliminated as far as practicable. Analytical test results are included in Appendix B-5. APPENDIX B-1 Soil Testing – Grain Size Curves Particle Size, Atterberg Limit, and USCS Analyses for Soils Client: Project: Sample ID: Balcones Geotechnical 0121-014 - Barton Springs Rd W-4 (56) 3 ' 2'' 1.5'' 1'' 3/4'' 1/2 ' 3/8'' #4 #10 #20 #40 #60 #100 #200 TRI Log #: 72382.5 100 75 50 25 r e n F i t n e c r e P Particle Size Analysis 0 100 D4221 10 110 100 ) I P ( x e d n I y t i c i t s a P l 90 80 70 60 50 40 30 20 10 0 MH or OH CL - ML ML or OL 1 0.1 0 01 0.001 0 10 20 30 40 50 60 70 80 90 100 110 120 130 Particle Size (mm) Mechanical Sieve Dispersed Vacuum with Agitation ASTM D422-63 ASTM D422-63 ASTM D4221 Liquid Limit (LL) Atterberg Limits ASTM D4318, Method A : Multipoint, Air Dried Liquid Limit Plastic Limit Plastic Index 56 22 34 (NL = No Liquid Limit, NP = No Plastic Limit) USCS Classification (ASTM D2487) Fat clay (CH) Moisture Content (%) ASTM D2216 Organic Content (%) ASTM D2974-C Particle Size Percent Passing mm 0.028 0.018 0.011 0.008 0.005 0.003 0.001 97.0 92.7 88.3 86.2 82.1 76.4 59.7 Particle Size mm Percent Passing - - - - - - - - - - - - - - - - - - - - - - - - - - - - Log-Linear Interpolation Carbonate Content (%) ASTM D4373 Particle Size mm 0.005 0.002 Percent Passing 81.4 69.9 Particle Size mm 0.005 0.002 Percent Passing - - - - Relative / Index Density Minimum (pcf) ASTM D4254 Maximum, Oven-Dry (pcf) ASTM D4253-1A Maximum, Wet (pcf) ASTM D4253-1B - - - - - - - - - - - - Percent Passing Gravel Sand Fines Sieve Designation - 3 in. 2 in. 1.5 in. 1 in. 3/4 in. 1/2 in. 3/8 in. No. 4 No. 10 No. 20 No. 40 No. 60 No. 140 No. 200 mm 76.2 50.8 38.1 25.4 19.0 12.7 9.51 4.76 2.00 0.841 0.420 0.250 0.106 0.074 100.0 100.0 100.0 100.0 100.0 100.0 100.0 100.0 99.9 99.8 99.5 99.3 99.0 98.9 0.0 1.1 98.9 N m,2µm,d 70 N m,2µm,nd - DX (mm), Log-Linear Interpolation 10 - - 30 - - 50 - - 60 1.2E-03 Cu - - Cc - - USDA Clay Sand (%) (2.0-0.05 mm) 2.5 Silt (%) (0.05-0.002 27.5 Percent Dispersion (ASTM D4221) - Clay (%) (< 0.002 mm) 70.0 Jeffrey A. Kuhn, Ph.D, P.E. 6/10/2022 Analysis & Quality Review/Date Particle Size, Atterberg Limit, and USCS Analyses for Soils Client: Project: Sample ID: Balcones Geotechnical 0121-014 - Barton Springs Rd W-5 (26) 3 ' 2'' 1.5'' 1'' 3/4'' 1/2 ' 3/8'' #4 #10 #20 #40 #60 #100 #200 TRI Log #: 72382.4 100 75 50 25 r e n F i t n e c r e P Particle Size Analysis 0 100 D4221 10 110 100 ) I P ( x e d n I y t i c i t s a P l 90 80 70 60 50 40 30 20 10 0 MH or OH CL - ML ML or OL 1 0.1 0 01 0.001 0 10 20 30 40 50 60 70 80 90 100 110 120 130 Particle Size (mm) Mechanical Sieve Dispersed Vacuum with Agitation ASTM D422-63 ASTM D422-63 ASTM D4221 Liquid Limit (LL) Atterberg Limits ASTM D4318, Method A : Multipoint, Air Dried Liquid Limit Plastic Limit Plastic Index 63 24 39 (NL = No Liquid Limit, NP = No Plastic Limit) USCS Classification (ASTM D2487) Fat clay (CH) Moisture Content (%) ASTM D2216 Organic Content (%) ASTM D2974-C Particle Size Percent Passing mm 0.030 0.020 0.011 0.008 0.006 0.003 0.001 94.4 86.9 84.4 81.9 82.3 75.6 63.8 Particle Size mm Percent Passing - - - - - - - - - - - - - - - - - - - - - - - - - - - - Log-Linear Interpolation Carbonate Content (%) ASTM D4373 Particle Size mm 0.005 0.002 Percent Passing 81.0 70.7 Particle Size mm 0.005 0.002 Percent Passing - - - - Relative / Index Density Minimum (pcf) ASTM D4254 Maximum, Oven-Dry (pcf) ASTM D4253-1A Maximum, Wet (pcf) ASTM D4253-1B - - - - - - - - - - - - Percent Passing Gravel Sand Fines Sieve Designation - 3 in. 2 in. 1.5 in. 1 in. 3/4 in. 1/2 in. 3/8 in. No. 4 No. 10 No. 20 No. 40 No. 60 No. 140 No. 200 mm 76.2 50.8 38.1 25.4 19.0 12.7 9.51 4.76 2.00 0.841 0.420 0.250 0.106 0.074 100.0 100.0 100.0 100.0 100.0 100.0 100.0 100.0 99.8 99.6 99.4 99.2 98.8 98.5 0.0 1.5 98.5 N m,2µm,d 71 N m,2µm,nd - DX (mm), Log-Linear Interpolation 10 - - 30 - - 50 - - 60 - - Cu - - Cc - - USDA Clay Sand (%) (2.0-0.05 mm) 4.8 Silt (%) (0.05-0.002 24.4 Percent Dispersion (ASTM D4221) - Clay (%) (< 0.002 mm) 70.8 Jeffrey A. Kuhn, Ph.D, P.E. 6/10/2022 Analysis & Quality Review/Date APPENDIX B-2 Pressure Swell Testing Swell Pressure Measurement with Multistage Unloading Client: Project: Specimen: Balcones Geotechnical 0121-014 - Barton Springs Rd W-4 (57) TRI Log #: Test Method: 72390.20 ASTM D4546-B MOD Stage Normal Stress (psf) Water Content, w (%) Diameter, d (in) Height, h (in) Total Unit Weight (pcf) Dry Unit Weight (pcf) Void Ratio, e De / Dlog(s) Degree of Saturation, S (%) Strain (%)3,4 262 - - 1.009 - - 0.426 -0.064 - -0.510 The intact sample was provided by the client. A specimen was trimmed from the sample using a trimming turntable and mounted. Gs was assumed to be 2.75. Calculations include measured machine deflections. Normal Stress (psf)3,4 131 17.2 - 1.017 134.2 120.9 0.437 -0.037 ≈100 -1.299 Initial1,2 120 11.0 1.996 1.004 134.2 120.9 0.418 - 72.3 0.000 340 - - 1.004 - - 0.418 - - 0.000 - - - - - - - - - - - - - - - - - - - - 1. 2. In the specimen ring. 3. Sign convention: (+) Compression/Collapse, (-) Expansion/Swell 4. Modification: The initial stage of ASTM D2435 testing was performed in which the normal load required to prevent swelling is recorded. This value is being reported as the "Swell Pressure". Please note that alternate methods to determine "Swell Pressure" in an oedometer are presented in ASTM D4546 and thus this modified method could be considered a modification of both methods alike. Following the measurement of the swell pressure the sample was subsequently unloaded in a series of stages. e , o i t a R d i o V 10 0.50 0.45 0.40 0.35 0.30 Normal Stress, sv (psf) 100 1,000 10,000 Jeffrey A. Kuhn, Ph.D., P.E. 6/18/2022 Analysis & Quality Review/Date Page 1 of 2 Swell Pressure Measurement with Multistage Unloading Client: Project: Specimen: Balcones Geotechnical 0121-014 - Barton Springs Rd W-4 (57) TRI Log #: Test Method: 72390.20 ASTM D4546-B MOD Stage 1: Swell Pressure Measurement 400 Stage 1: Swell Pressure Measurement 400 ) f s p ( e r u s s e r P 300 200 100 0 0.1 1 10 100 Time (minutes) 1000 10000 ) f s p ( e r u s s e r P 300 200 100 0 0 10 20 30 40 50 Root Time (square root of minutes) Stage 2: 262 psf Stage 2: 262 psf ) n i ( n o i t a m r o f e D -0.0070 -0.0060 -0.0050 -0.0040 -0.0030 -0.0020 -0.0010 0.0000 ) n i ( n o i t a m r o f e D -0.0070 -0.0060 -0.0050 -0.0040 -0.0030 -0.0020 -0.0010 0.0000 0.1 1 10 100 Time (minutes) 1000 10000 0 10 20 Root Time (square root of minutes) 30 Stage 3: 131 psf Stage 3: 131 psf ) n i ( n o i t a m r o f e D -0.0100 -0.0080 -0.0060 -0.0040 -0.0020 0.0000 0.0020 ) n i ( n o i t a m r o f e D -0.0100 -0.0080 -0.0060 -0.0040 -0.0020 0.0000 0.0020 0.1 1 10 100 Time (minutes) 1000 10000 0 Page 2 of 2 10 20 Root Time (square root of minutes) 30 40 40 APPENDIX B-3 Direct Shear Testing APPENDIX B-4 Consolidated Undrained Triaxial Compression Testing Consolidated-Undrained Triaxial Compression Client: Balcones Geotechnical Project: 0121-014- Barton Springs Rd. Sample: W-1 (23.5-25) (28.5-30) (33.5-35) TRI Log #: Test Method: ASTM D4767 72382.1 Specimens Test Setup 1 - 10.0 2 - 20.0 Initial Specimen Properties 2.00 4.41 18.9 128.3 107.9 2.01 4.32 18.8 130.0 109.4 3 - 30.0 2.00 4.46 19.5 127.2 106.4 Identification Depth/Elev. (ft) Eff. Consol. Stress (psi) Avg. Diameter (in) Avg. Height (in) Avg. Water Content (%) Bulk Density (pcf) Dry Density (pcf) Specific Gravity (Assumed) Saturation (%) Void Ratio, n B-Value, End of Saturation 2.75 90.9 0.57 1.00 88.1 0.59 0.97 87.6 0.61 0.97 4 - - - - - - - - - - Specimen Condition Remolded Specimen Preparation Mounting Method Consolidation Kneading and Impact Compaction, Six Lifts Wet Isotropic Post-Consolidation / Pre-Shear Void Ratio 0.48 0.50 0.50 Shear / Post-Shear Rate of Strain (%/hr) Avg. Water Content (%) 0.25 25.7 0.25 24.0 0.25 24.9 - - - At Failure Failure Criterion: Peak Principal Stress Difference, (s1'-s3')max Ratio, (s1'/s3')max Axial Strain at Failure (%), ea,f Minor Effective Stress (psi), s3'f Principal Stress Difference (psi), (s1-s3)f Pore Water Pressure, Duf (psi) Major Effective Stress (psi), s1'f Secant Friction Angle (degrees) Effective Friction Angle (degrees) Effective Cohesion (psi) 8.5 10.7 18.1 -0.7 28.9 27.3 13.3 21.2 28.4 -1.2 49.6 23.6 9.9 21.6 28.3 8.4 49.9 23.3 18.9 2.8 - - - - - - 3.3 7.9 15.6 2.1 23.5 29.7 - - - - - - 5.5 16.5 24.4 3.5 40.9 25.2 6.3 20.4 27.7 9.5 48.1 23.9 19.3 2.8 Note: The presented M-C parameters are based on a linear regression in modified stress space, across all assigned effective consolidation stresses. This fit does not purported to capture typical curvature of envelopes that may, in particular, be observed across broader range in effective stresses. Please note that the stresses associated with peak principal stress ratio and peak principal stress difference are presented in tabular form on the first page of the report. There are alternate interpretations to theses two failure criterion including but not limited to strain compatibility and post-peak. Jeffrey A. Kuhn , Ph.D., P.E., 9/7/2022 Analysis & Quality Review/Date 1 of 6 Consolidated-Undrained Triaxial Compression Client: Balcones Geotechnical Project: 0121-014- Barton Springs Rd. Sample: W-1 (23.5-25) (28.5-30) (33.5-35) TRI Log #: Test Method: ASTM D4767 72382.1 Shear Stress, t (psi) 50 40 30 20 10 0 0 Mohr-Coulomb Failure Criterion Peak Principal Stress Difference Peak Principal Stress Ratio 10 20 30 40 50 Effective Stress, s'(psi) Failure Criterion: Peak Principal Stress Effective Friction Angle (deg) Effective Cohesion (psi) Difference, (s1'-s3')max 18.9 2.8 Ratio, (s1'/s3')max 19.3 2.8 4 of 6 Consolidated-Undrained Triaxial Compression Client: Balcones Geotechnical Project: 0121-014- Barton Springs Rd. Sample: W-2 (7-8.5) (9-10.5) (13.5-15) (18.5-20) TRI Log #: Test Method: ASTM D4767 72382.2 Specimens Test Setup 1 - 5.0 2 - 15.0 Initial Specimen Properties 2.00 4.37 19.8 130.1 108.5 2.01 4.38 18.7 128.3 108.1 3 - 25.0 2.00 4.41 19.6 129.2 108.0 Identification Depth/Elev. (ft) Eff. Consol. Stress (psi) Avg. Diameter (in) Avg. Height (in) Avg. Water Content (%) Bulk Density (pcf) Dry Density (pcf) Specific Gravity (Assumed) Saturation (%) Void Ratio, n B-Value, End of Saturation 2.75 87.5 0.59 0.99 93.9 0.58 1.00 91.5 0.59 0.79 4 - - - - - - - - - - Specimen Condition Remolded Specimen Preparation Mounting Method Consolidation Kneading and Impact Compaction, Six Lifts Wet Isotropic Post-Consolidation / Pre-Shear Void Ratio 0.57 0.52 0.54 Shear / Post-Shear Rate of Strain (%/hr) Avg. Water Content (%) 0.25 27.8 0.25 25.2 0.25 24.4 - - - At Failure Failure Criterion: Peak Principal Stress Difference, (s1'-s3')max Ratio, (s1'/s3')max Axial Strain at Failure (%), ea,f Minor Effective Stress (psi), s3'f Principal Stress Difference (psi), (s1-s3)f Pore Water Pressure, Duf (psi) Major Effective Stress (psi), s1'f Secant Friction Angle (degrees) Effective Friction Angle (degrees) Effective Cohesion (psi) 8.6 6.1 13.4 -1.0 19.5 31.6 11.6 15.3 21.7 -0.3 37.0 24.6 15.0 24.8 31.0 0.3 55.7 22.6 18.6 2.7 - - - - - - 1.4 3.4 10.4 1.7 13.8 37.5 - - - - - - 6.0 11.5 19.7 3.5 31.2 27.5 5.4 19.4 27.4 5.7 46.8 24.4 20.2 2.5 Note: The presented M-C parameters are based on a linear regression in modified stress space, across all assigned effective consolidation stresses. This fit does not purported to capture typical curvature of envelopes that may, in particular, be observed across broader range in effective stresses. Please note that the stresses associated with peak principal stress ratio and peak principal stress difference are presented in tabular form on the first page of the report. There are alternate interpretations to theses two failure criterion including but not limited to strain compatibility and post-peak. Jeffrey A. Kuhn , Ph.D., P.E., 9/7/2022 Analysis & Quality Review/Date 1 of 6 Consolidated-Undrained Triaxial Compression Client: Balcones Geotechnical Project: 0121-014- Barton Springs Rd. Sample: W-2 (7-8.5) (9-10.5) (13.5-15) (18.5-20) TRI Log #: Test Method: ASTM D4767 72382.2 60 50 40 Shear Stress, 30 t (psi) 20 10 0 0 Mohr-Coulomb Failure Criterion Peak Principal Stress Difference Peak Principal Stress Ratio 10 20 30 40 50 60 Effective Stress, s'(psi) Failure Criterion: Peak Principal Stress Effective Friction Angle (deg) Effective Cohesion (psi) Difference, (s1'-s3')max 18.6 2.7 Ratio, (s1'/s3')max 20.2 2.5 4 of 6 APPENDIX B-5 Analytical Testing Client: Project: Balcones Geotechnical 0121-014- Barton Springs Rd. TRI Log #: 72383 Jeffrey A. Kuhn, Ph.D., P.E., 6/2/2022 Quality Review/Date Analytical C O C # e n L i - - 1 Sample Identification Chloride Content (mg/kg) Sulfate Content (mg SO4/kg) pH Resistivity (ohm-cm) Test Method Method Detection Limit (MDL) W-4 (25) ASTM D512 [5 mg/l](2) ASTM D516 [5 mg/l](2) 150 7,600 ASTM G51 ASTM G57 - 6.59 - 3.8E+02 (1) ND No Detection - Below Method Detection Limit (MDL) (2) MDL is volumetric. Results are mass per mass of dry soil. Page 1 of 1 C-8 – Proposed Project Construction Cost Appendix D – Agency Discussions D-1 - Initial TX Historic Commission Meeting – June 2022