Customer Energy Solutions FY 25 Savings Report — original pdf
Backup
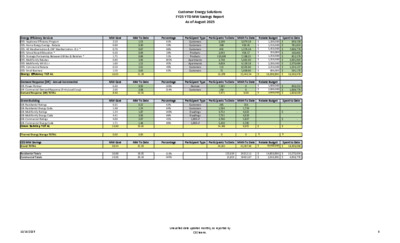
Customer Energy Solutions FY25 YTD MW Savings Report As of August 2025 Energy Efficiency Services EES- Appliance Efficiency Program EES- Home Energy Savings - Rebate EES- AE Weatherization & CAP Weatherization - D.I. * EES- School Based Education * EES- Strategic Partnership Between Utilities & Retailers * EES- Multifamily Rebates EES- Multifamily WX-D.I.+ EES- Commercial Rebate EES- Small Business Energy Efficiency TOTAL Demand Response (DR) - Annual Incremental DR- Power Partner DR- Commercial Demand Response (frmly Load Coop) Demand Response (DR) TOTAL Green Building GB- Residential Ratings GB- Residential Energy Code GB- Multifamily Ratings GB- Multifamily Energy Code GB- Commercial Ratings GB- Commercial Energy Code Green Building TOTAL MW Goal 2.50 0.90 0.70 0.30 1.75 0.90 1.60 6.50 1.50 16.65 MW Goal 6.40 2.00 8.40 MW Goal 0.35 1.48 1.34 4.41 4.60 1.71 13.89 MW To Date 1.53 0.30 0.67 0.09 0.89 2.66 1.52 2.61 0.93 11.20 MW To Date 9.93 3.08 13.01 MW To Date 0.22 1.24 1.87 3.93 2.07 1.48 10.81 Thermal Energy Storage TOTAL 0.00 0.00 Percentage 61% 34% 96% 29% 51% 295% 95% 40% 63% Percentage 140% 154% Percentage 63% 84% 140% 89% 45% 86% Participant Type Participants To Date MWh To Date Customers Customers Customers Products Products Apartments Apartments Customers Customers 2,199 298 845 2,043 133,683 2,748 4,658 115 72 12,978 3,074.19 429.45 1,276.18 458.57 7,188.35 5,681.00 4,129.18 8,505.66 1,699.96 32,442.54 Rebate Budget $ 1,200,000 $ 1,550,000 $ 5,450,000 $ 350,000 $ 1,250,000 $ 1,250,000 $ 2,200,000 $ 2,250,000 $ 800,000 $ 16,300,000 Spent to Date $ 929,158 $ 781,854 $ 7,699,779 $ 100,863 $ 852,379 $ 2,005,964 $ 2,370,684 $ 1,234,127 $ 595,170 $ 16,569,978 Participant Type Participants To Date MWh To Date Devices Customers 7,281 190 7,471 0 0 0.00 Rebate Budget $ 1,600,000 $ 2,000,000 $ 3,600,000 $ $ $ 830,253 1,008,776 1,839,029 Participant Type Participants To Date MWh To Date Rebate Budget Spent to Date Customers Customers Dwellings Dwellings 1,000 sf 1,000 sf 285 1,594 4,752 7,731 3,760 5,420 14,362 0 256 1,719 4,022 4,610 5,827 4,785 9,955 0 $ - $ - $ - $ - $ - $ - CES MW Savings Grand TOTAL Residential Totals Commercial Totals MW Goal 38.94 MW To Date 35.02 Percentage Participant Type Participants To Date MWh To Date 34,811 42,397.92 Rebate Budget $ 19,900,000 Spent to Date $ 18,409,008 16.88 14.06 19.05 20.43 113% 145% 155,634 21,853 24212.12 19431.87 $ $ 14,850,000 2,010,206 $ $ 15,570,934 4,058,776 10/13/2025 Unaudited data updated monthly, as reported by CES teams. 3 Customer Energy Solutions FY25 YTD MW Savings Report As of August 2025 Participant Type Participants To Date MWh To Date Incentive Budget $ 2,500,000 $ 2,750,000 Customers Customers 6,240 13,013 Spent to Date 1,407,393 6,739,022 19,253 $ 5,250,000 $ 8,146,415 444 36 214 694 MW Goal 7.00 5.00 12.00 Participant Type Customers Customers Participant Type Customers Customers MW To Date 3.61 12.83 1.90 18.34 Participants 20,067 424 20,491 Participants 203 206 409 Percentage 52% 257% MWh 23,681.46 58,866.06 82,547.52 MWh 260.03 263.25 523.28 Outreach 8/02 - Tabled the Budget Town Hall meeting for Districts 1 & 4 8/28 - Spoke at the Texas Clean Energy Conference in Austin Through July, 65% Single Family homes and 14 multifamily developments (with a total of 2,519 units) receiving AEGB ratings are in SMART Housing developments in the AE service area. Customer Renewable Solutions Residential Commercial Unincentivized Solar Energy TOTAL GreenChoice Residential Commercial GreenChoice TOTAL Community Solar Market Rate CAP Community Solar TOTAL Energy Efficiency Programs Customer Renewable Solutions (Solar/Community Solar/GreenChoice) Green Building Notes: AE Weatherization budget excludes rollover. All numbers are unaudited and will be adjusted in line with financial updates. This report has historically been filtered by paid date per enrollment. Beginning June 2022 the EES data is filtered on payment authorization (approval) date. 10/13/2025 Unaudited data updated monthly, as reported by CES teams. 3 Customer Energy Solutions FY25 YTD MW Savings Report As of August 2025 MW Saving Goal Tracking Solar Goal Tracking 45.00 40.00 35.00 30.00 25.00 20.00 15.00 10.00 5.00 0.00 13.97 14.96 16.10 18.35 19.55 21.17 8.69 10.21 7.10 35.02 31.31 14.00 38.94 12.00 10.00 8.00 6.00 4.00 2.00 0.00 12.83 7.93 7.06 7.06 4.85 4.90 5.77 5.51 7.000 5.000 6.08 4.02 4.72 5.04 3.50 3.00 3.09 3.09 3.71 3.82 2.43 1.32 1.55 0.80 Oct Nov Dec Jan Feb Mar Apr May Jun Jul Aug Sep Oct Nov Dec Jan Feb Mar Apr May Jun Jul Aug Sep Actual Goal Res Actual Com Actual Res Goal Com Goal 10/13/2025 Unaudited data updated monthly, as reported by CES teams. 3