Item 2- April 2026 CDC Report — original pdf
Backup
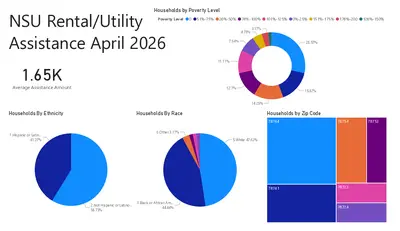
Households by Poverty Level Power BI Desktop NSU Rental/Utility Assistance April 2026 Poverty Level 1.65K Average Assistance Amount 0 51%-75% 26%-50% 76%-100% 101%-125% 0%-25% 151%-175% 176%-200 126%-150% 3.17% 4.76% 7.94% 11.11% 12.7% 14.29% 28.57% 15.87% Households By Ethnicity Households By Race Households by Zip Code 78744 78754 78753 1.Hispanic or Latin… 41.27% 6.Other 3.17% 5.White 47.62% 2.Not Hispanic or Latino … 58.73% 3.Black or African Am… 44.44% 78741 78723 78724 NSU Oasis Assistance April 2026 4535 Services Provided Count of Household by Race/Ethnicity 0.71% 2.54% 6.84% Count of Household by Food Category Power BI Desktop Count of Household by Non-Food Category Market Days: Dove Springs - Market Food Pantry: East A… Market Days… Fresh Food For Families Progr… Fresh Food For Fa… Fresh Food For Fa… Food Pantry: Montopolis (PA180) -… Market Days: East… Fresh Food For… Clothing: Blackland (AD032) - … Fresh Food For Familie… Fresh Food For… Count of Household by Zip code 78741 78702 (Blank) 78744 78723 78724 Race/Ethnicity Hispanic, Latino/Latina, or Spanish No 'Race/Ethnicity' Entered Black or African American White Hispanic, Latino/Latina, or Spanish… Asian Prefer Not to Answer Black or African AmericanWhite Hispanic, Latino/Latina, or SpanishP… Some Other Race or Ethnicity Black or African AmericanHispanic, … 15.83% 45.45% 23.75% Rent/Utility Assistance By Zip Code Oasis Services by Zipcode Power BI Desktop © 2026 TomTom, © 2026 Microsoft Corporation © 2026 TomTom, © 2026 Microsoft Corporation © 2026 TomTom, © 2026 Microsoft Corporation © 2026 TomTom, © 2026 Microsoft Corporation