Page 1 of 6 The Austin Generation Resource Planning Task Force (‘the Task Force’) convened in a meeting at Austin City Hall, Council Chambers, 301 West Second Street, Austin, Texas. CALL TO ORDER – Michael Osborne called the meeting to order at 2:36 p.m. Task Force members in attendance: Carol Biedrzycki, Barry Dreyling, Michael Osborne, Cyrus Reed, Tom “Smitty” Smith and Michele Van Hyfte. Clay Butler, Grace Hsieh and Mike Sloan were not present at the Call to Order, but arrived afterwards. APPROVAL OF MINUTES 1. The motion to approve minutes of the May 21, 2014 meeting, by Ms. Biedrzycki and seconded by Mr. Dreyling, passed on a vote of 6-0 with Mr. Butler, Ms. Hsieh and Mr. Sloan off the dais. CITIZEN COMMUNICATION: GENERAL The following persons addressed the Task Force: Scott Burton – urged expanding use of district chilling technology. Paul Robbins – criticized a proposal to increase the free weatherization program saying there were better ways to lower cost, service more people, save energy and prevent pollution. BRIEFINGS AND PRESENTATIONS Mr. Osborne suggested moving up Item 3 to hear Task Force members’ presentation. 3. Presentations by Task Force members relating to Council Resolution No. 20140306-024, which formed the Task Force and set its mission to examine and make recommendations regarding an update to the Generation Plan. The following members made presentations: a. Ms. Biedrzycki – “Low -Income Energy Efficiency Goals for 2024” b. Mr. Reed – “Austin’s Clean Energy Future” c. Mr. Dreyling and Ms. Van Hyfte – “Affordability, Availability, Clean/Renewable, DSM” d. Mr. Sloan – “Mike Sloan on Austin Generation Planning” e. Mr. Smith – “Creating a Clean Energy Future for Austin Energy” f. Mr. Osborne – “Generation Task Force: Presentation by Michael J. Osborne” Mr. Butler, Ms. Hsieh and Mr. Sloan arrived during presentations. 2. Presentation by Austin Energy on the methodology for determining the value of utility solar generation – Mr. Butler, Mr. Reed and Mr. Sloan provided clarification to Austin Energy staff on what was being requested by the Task Force for this presentation. Mr. Osborne postponed the presentation to the June 4 meeting. Mr. Sloan suggested the Task Force review new materials provided by Austin Energy regarding Items 4 and 5. Mr. Osborne agreed. OLD BUSINESS 4. Discussion of past Austin Energy presentation regarding wholesale real time market purchases including those related to unplanned outages (Item #4 on May 7, 2014 agenda) …
Value of Solar Methodology Babu Chakka, Manager - Energy Market Analysis, May 28th, 2014 Value of Solar Study_AGRPTF Presentation Value of Solar Review •First study conducted in 2006 by Clean Power Research, value used internally •Value has fluctuated historically based on market changes •Integrated into residential solar tariff in 2012 and reviewed annually •In July 2013, Clean Power Research was hired again to review the study •In October 2013 –CPR presented the study results to the Joint EUC/RMC meeting –VoS for 2014 was announced to be effective from Jan 1st, 2014 2 How is the VoS calculated? 3 Value of Solar Components 4 0.0000.0200.0400.0600.0800.1000.1200.140Cents per kWh NodalLoss SavingsT&D DeferralEnvironmentalGen. CapacityEnergyInitial (2012) VoS 12.8 Cents Approach to Calculate Energy and Capacity Value of PV Energy Value: •Obtain implied hourly heat rates from 2014 to 2022 •Match 2011 PV fleet production to 2014 – 2022 hourly heat rates •Multiply 2011 PV fleet production times 2014 - 2022 heat rates •Sum results and divide by energy to obtain results in $/kWh Capacity Value: •Implied value of capacity based on avoided cost of a simple cycle gas turbine –Capital cost of a simple cycle gas turbine technology is based on EIA Spring 2013 update. 5 Sample Energy Value Calculation 6 Prepared by Clean Power Research for Austin EnergyNodal Price Value Calculation19[A][B]= [A] x [B]HE (CST)Fleet Energy (MWh) Nodal Price ($/MWh)Value ($)1/1/2011 6:000.00028.460.001/1/2011 7:000.00032.390.001/1/2011 8:000.38534.8013.381/1/2011 9:001.95336.2070.681/1/2011 10:004.01636.97148.471/1/2011 11:005.59934.06190.711/1/2011 12:006.58741.78275.211/1/2011 13:006.94029.13202.171/1/2011 14:006.76732.46219.661/1/2011 15:006.03729.13175.851/1/2011 16:004.78226.90128.641/1/2011 17:002.92127.7681.081/1/2011 18:000.89534.5930.961/1/2011 19:000.03646.811.671/1/2011 20:000.00044.770.001/1/2011 21:000.00042.590.00* Repeat calculation for all hours of year and sum result. VOS Calculation 7 •Guaranteed Fuel Value = Energy Value * (1+Loss factor) Where Energy Value = ∑(Heat rate * Gas Price* PV Production*Risk Free discount factor) ∑(PV Production*Risk Free discount factor) •Plant O & M value = ∑(O & M Cost *(1+Inflation)^year* PV Capacity*Risk Free discount factor) ∑(PV Production*Risk Free discount factor) •Generation Capacity value = ∑(Annual Capital carrying cost* PV capacity*Risk Free discount factor) ∑(PV Production*Risk Free discount factor) * (1+ Loss factor ) *load match* (1+ Loss factor) VOS Calculation Contd… 8 •Avoided Transmission cost = where Transmission cost is Austin Energy contribution to ERCOT T-Cost •Avoided Environmental cost = $0.02/kWh *load match* (1+ Loss factor ) ∑(Transmission cost* PV capacity*Risk Free discount factor) ∑(PV Production*Risk Free discount factor) Key Parameters 9 Prepared by Clean Power Research for Austin EnergyKey Parameters for Value of SolarData inferred from Austin Energy’s Heat Rate Forecast (2014-2022) and PV …
1 GENERATION TASK FORCE May 28th 2014 Presented by Michael J Osborne 2 GENERATION TASK FORCE 3 GENERATION TASK FORCE 4 ENERGY UNIFICATION 4 5 THE BIG PICTURE What is the future for gas prices? Will the price of Large Scale Solar continue to decrease? When and how will carbon be priced in the market? When will Distributed Solar and Smart Grid demand reduction erode load growth? Water 5 6 AE GAS PRICE FORECAST 7 ACTUAL HENRY HUB PRICES 8 EIA NATURAL GAS 8 9 EIA NATURAL GAS 9 10 SOLAR IS THE NEW WIND 11 SOLAR IS THE NEW WIND According to the latest data, solar power capacity installed around the world this year will beat wind power for the first time ever. "Photovoltaic plants will add about 36.7 GW globally in 2013 and wind farms 35.5 GW 12 SOLAR POWER PLANT COSTS 12 13 WILL SOLAR PRICES DECLINE? Solar tax credit expires in 2016 13 14 SOLAR PRICES VS GAS 14 15 SOLAR VS GAS VS WIND 15 16 PRICING CARBON 16 17 LARGEST MACHINE ON EARTH 18 LARGEST RE MACHINE ON EARTH 19 TO POWER AUSTIN Solar provides .3 TWhs/section Austin Energy makes 14 TWhs/year Total area to power Austin..45 sections Total area of Austin...300 sections Usable rooftop area ...10 sections Existing Power Plants...35 sections 19 20 REPURPOSING FAYETTE 10 square miles 2400 acre lake One gigawatt of solar 500 MWs at reduced density Replace sequestered coal fuel with renewable fuel Build New advanced plant Establish non AE task force 20 21 TOMORROW WILL CHANGE US
Texas Ratepayers’ Organization to Save Energy Low-Income Energy Efficiency (EE) Goals for 2024 Carol Biedrzycki, Texas ROSE (Ratepayers’ Organization to Save Energy) to the Austin Generation Resource Planning Task Force May 28, 2014 Texas Ratepayers’ Organization to Save Energy AUSTIN HOUSEHOLDS (income as % of Federal Poverty Guideline) Below 200%: 131,501 households (38%) 200 to 399%: 87,576 households (26%) Above 400%: 123,604 households (36% ) Texas Ratepayers’ Organization to Save Energy FEDERAL POVERTY GUIDELINE For a Family of Four in 2014 100% $23,850 200% $47,700 300% $80,550 400% $95,400 Minimum Budget Austin/Round Rock $66,970 Texas Ratepayers’ Organization to Save Energy 2009 Task Force EE Recommendations •Continue stimulus weatherization and expand programs for households up to 200% of Federal Poverty Guideline (FPG) •Explore programs for households with income at 200 to 400% of FPG Texas Ratepayers’ Organization to Save Energy 2009 Task Force EE Recommendations •Find resources to make distributed generation affordable for 0 to 400% FPG •More energy efficiency outreach for renters (ECAD) Texas Ratepayers’ Organization to Save Energy 2009 Task Force EE Recommendations •Include residential and low-income consumer representative on future generation task force Texas Ratepayers’ Organization to Save Energy Results of 2009 Recommendations •Low-income weatherization decreased •No programs for 200 to 400% FPG •No distributed generation for low-income •No proven increase in EE for low-income renters Texas Ratepayers’ Organization to Save Energy ENERGY EFFICIENCY PROGRAM SPENDING 2012 Total $17.7 million Texas Ratepayers’ Organization to Save Energy 2024 Proposal •Establish a 21.45 MW goal (5% of remaining 429 MW goal) for low-income weatherization (up to 200% of FPG) Texas Ratepayers’ Organization to Save Energy 2024 Proposed Recommendation •Establish a 21.45 MW goal (5% of remaining 429 MW goal) for low moderate income energy efficiency (201% to 400% of FPG) Texas Ratepayers’ Organization to Save Energy 2024 Proposed Recommendation •Establish a 5 MW goal (10% of 50 MW goal in homes and businesses) for distributed generation for low and low moderated income (0% to 400% of FPG) households Texas Ratepayers’ Organization to Save Energy Basis of Recommendation •Public Utility Commission Rule §25.181(c)(27) and (e)(3)(F) require that no less than 5% of savings achieved through programs for customers with income under 200% of Federal Poverty Guideline Texas Ratepayers’ Organization to Save Energy PUC Standard is Not Enough •Apply 5% of MW savings goal to 26% of the population with incomes at 200 to 400% of the FPG •Apply 10% of distributed …
AUSTIN’S CLEAN ENERGY FUTURE Austin Energy’s 2024 Climate Protection & Generation Resource Plan Cyrus Reed, Conservation Director, Lone Star Chapter Sierra Club May 28, 2014 1 MAY 27, 2014 Austin Energy Has Been A Leader …But we can’t afford to fall behind Cleveland. AE has been leader on EV, EE, SOLAR, WIND, CARBON REDUCTION We must continue this leadership role on these and become carbon neutral Other cities are making commitments to renewable power and carbon reductions Seattle: Carbon neutral by 2050 Chicago: Reduce emissions by 80% from 1990 levels by 2050 for both governments and communities Cleveland: Reduce emissions by 80% below 2010 levels by 2050, with interim 16% reduction by 2020. Currently 50% of Clevelanders on 100% renewable power. Cincinnati: Reduce emissions by 84% by 2050 and by 8% within 4 years. City aggregation Austin – City Council adopted new resolution of carbon neutrality by 2050; AE current goal of 35% renewable energy and 20% reduction by 2020 2 MAY 27, 2014 Austin Energy 2024 Plan Must: Address climate change emissions & climate change impacts ; Put City of Austin on glidepath to zero carbon from the utility by 2035, to be zero carbon for the city by 2050; Bolster efficiency, renewable and climate change goals; Be affordable and equitable for ALL residential, commercial and industrial consumers; Address our oldest and dirtiest fossil fuel plants; and Take advantage of newer technologies like demand response, storage, and solar power. 3 MAY 27, 2014 Our 2025 Scenario: Put Austin On Zero By 2050 Glidepath Character Value % of Annual Electricity Demand Met 100% % of Peak Hourly Demand Met 97% generation, 3% demand response Carbon Emissions (metric tons) 1,158,216 % Generation from Renewables in 2024 62.4% % Capacity from Renewables in 2024 61.3% Annual Fuel Cost 280 Total Capital 30-year Cost (including PPAs) $6.5 billion MAY 27, 2014 4 Our Scenario: High Renewable, High Efficiency, Low Fossil Fuel, Low GHG Character Value % of GHG Emissions Reduced 81% % of Water Consumption Reduced 37% Demand Side (Efficiency, Green Buildings and DR) 1200 MWs, including 200 MWs DR Total Solar in 2024 500-600 MWs Total Wind in 2024 1,500 MWs Local / Utility-Scale Storage in 2024 New Gas by 2024 400 MWs 200 MWs 5 MAY 27, 2014 Dealing With Our Oldest And Dirtiest Coal power is dated We envision a three-year phased retirement between 2015 and 2018 with a priority …
Mike Sloan on Austin “Generation Planning” Generation Resource Planning Task Force Austin, Texas May 28, 2014 Mike Sloan Virtus Energy Austin, Texas (512) 476-9899 / sloan@vera.com Presented to: By: VERA! What does Austin Want ? Key Structural Issues 1. AE Mission & Priorities 2. Business Model 3. Organization 4. Oversight What is AE's Mission ? "Deliver clean, affordable, reliable energy and excellent customer service." … make $$$ for city government ….maximize long-term benefits to people of Austin In practice, other influences are: Current Model GROWTH Business Model Reform for "Clean & Affordable" % Better Model REDUCE FIXED Utility Revenue (Customer Bills) General Fund Transfer (GFT) seek lower revenue requirements / stable GFT Austin Energy currently seeks GROWTH in burning fuel & selling kWhs: bad for affordability and environment; change to a FIXED fund transfer allows City to reduce energy use Owners Basic Utility Structure Customers Board Regulator Policy Utility Austin City Council serves all major functions as Austin's Board, Regulator & Policy-maker In General: Utility owners make money from customers on prudent actions approved by a regulator A Community-owned utility (such as AE) should have no conflict of interest since owner & customer are the same: the community Is Oversight of AE Sufficient ? Transparency: Secret stronger oversight trust the utility Governance: Oversight Staff: full-time professionals independent of utility? city council, board, etc Transparent Austin Energy is likely the largest utility in the world governed by a city council, yet council has no full-time, professional energy advisors independent of the utility; many types of information on AE are no longer available to the public that previously were available. Suggestions for Net Zero Carbon 1. De-Carbonization Plan 2. Seek Low-Cost, Clean Resources 3. Maximize Efficiency & Local Solar 4. Be Flexible (use market, voluntary rates, etc) As a general rule: Low-Cost is better than Expensive Lowest Cost Options: wind solar DSM natural gas AE Resource Cost Estimates Source: Austin Energy, Generation Plan update materials (extract), 2014 There should be many DSM options at much lower cost than the range shown above This graph is levelized cost only – it does not take into account the timing/value of resources Source: Navigant Consulting, “Benchmarking and Program Review” Dec 2010. http://www.austinchronicle.com/media/content/1292117/ae_benchmarking_and_program_review_2.pdf this source is illustrative of contrasting info from third party sources that differs from info provided by AE This slide is from proprietary report on AE released to the public in 2012 (redacted …
Creating a Clean Energy Future for Austin EnergyPublic Citizen’s Preliminary Suggestions for Updating the Austin Energy Resource, Generation and Climate Protection Plan to 2024Tom “Smitty” SmithDirector, Texas OfficeMay 29, 2014 Our Priorities•Improve human and environmental health by using clean energy options•Keep energy prices affordable for Austin Energy customers, especially residential customers and small businesses•Ensure that Austin Energy continues to provide a positive example for the rest of the state and country when it comes to creative energy solutions and investing in clean energy technologies•Grow the local and state economies by investing in local, sustainable energy sources that create jobs and tax revenue•Improve equity in Austin by ensuring that low-and medium-income families have access to energy efficiency and solar energy programs Goals Matter•Strong renewable energy, energy efficiency and greenhouse gas emissions reduction goals have driven Austin Energy to actively seek out resources to meet these goals•35% renewable energy goal pushed AE to make wind investments a priority•200 MW solar goal has pushed AE to ensure that solar is part of the mix and resulted in the 150 MW solar deal that will lowerenergy prices for customers•100 MW local solar goal makes community solar a priority•Demand reduction goal has already caused AE to avoid building a new costly power plant•Just because a technology is already cost competitive, doesn’t negate the need for a goal because RFPs are often resource specific. Health Costs of Fayette•The annual cost of health impacts from the pollution from the Fayette coal plant are about $55.5 million. (Clean Air Task Force) The health impacts include:•Deaths•Heart Attacks•Asthma Attacks and ER Visits for Asthma•Hospital Admissions•Chronic Bronchitis Water Use and Contamination•Coal-and gas-fired power plants use precious water•The Fayette coal plant needs over 5 billion gallons of water per year to operate.•Each natural gas or oil fracking job uses millions of gallons of water. That water is disposed of in injection wells and can contaminate groundwater and cause earthquakes.•Wind needs no water to operate•Solar facilities use only a very small amount of water for occasional washing of the panels. Affordability Challenge•Affordability goal wasn’t clearly enough established•Goal says that electric rates can’t rise by more than 2% each year•Austin Energy hasn’t decided if the Power Supply Adjustment (PSA) Charge is included in that 2% limit.•Limiting reliance on energy sources with fluctuating prices will protect consumers from unexpected bill increases. •If Austin Energy decides that the PSA Charge isn’t included, customers will be exposed …
Resource Generation Task Force Member Presentation Michele Van Hyfte, AIA LEED AP BD+C Barry Dreyling, P.E. Overview •Affordability •Availability •Clean/Renewable •DSM Affordability •On the premise that people need access to reasonably priced energy we reiterate our support for the existing affordability goal. •Customer rate increases <2%/year •Customer rates in bottom 50% of ERCOT key areas – major cities and areas surrounding Austin •Applies to “all in” customer bill cost •Applies to all customer classes – residential, commercial, industrial •Regular benchmarking of rates (residential, commercial and industrial) in ERCOT key areas •AE continue to provide/update affordability projections 5 years into the future Availability •AE needs a diverse portfolio of both base and variable generation •Generation resources available 24/7 •Protection from nodal market spikes •Provides hedge against fluctuations in the price of any one fuel Clean/Renewable •Renewables, notably wind and solar, appear to have become competitive and affordable •Do not have a preference for the “flavor” of renewables in AE’s portfolio –Should be based on competitive cost –Should be based on TOD when there is a need for more generation –Integrate with ERCOT reliability requirements •Propose to increase the renewable goal to 45% by 2024 •Difficult to go beyond that and maintain availability without viable storage option DSM •Halfway to the existing 800MW goal •All the low hanging fruit is gone •All the fruit that can be reached with a 10 ft. ladder is gone. •Would support an increase to the DSM goal if it can be achieved cost effectively •Support added emphasis on low income energy efficiency goals •Shift to equitable distribution of DSM funds to customer classes
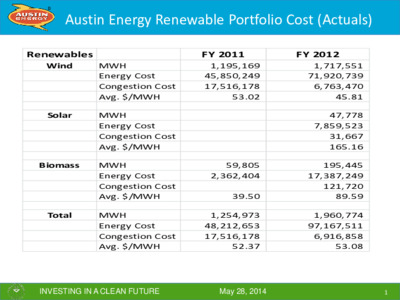
INVESTING IN A CLEAN FUTURE May 28, 2014 Austin Energy Renewable Portfolio Cost (Actuals) 1 RenewablesFY 2011FY 2012WindMWH1,195,1691,717,551Energy Cost45,850,24971,920,739Congestion Cost17,516,1786,763,470Avg. $/MWH53.0245.81SolarMWH47,778Energy Cost7,859,523Congestion Cost31,667Avg. $/MWH165.16BiomassMWH59,805195,445Energy Cost2,362,40417,387,249Congestion Cost121,720Avg. $/MWH39.5089.59TotalMWH1,254,9731,960,774Energy Cost48,212,65397,167,511Congestion Cost17,516,1786,916,858Avg. $/MWH52.3753.08 INVESTING IN A CLEAN FUTURE May 28, 2014 Austin Energy Generation Production Cost (Historical) 2 FY2011FY2012Estimated System Wide Fuel Factor$/MWH30.90$ 35.98$ Estimated Non-Fuel cost$/MWH20.49$ 22.53$ Total Production Cost$/MWH51.39$ 58.51$ Note: Non-Fuel cost includes O & M, Debt service (P & I) and does not include coverage, A & G expenses etc. INVESTING IN A CLEAN FUTURE May 28, 2014 Austin Energy Load vs. Generation (2011) 3 MonthAE GenerationAE LoadImbalanceImbalance %Jan_2011843,311982,454139,14414%Feb_2011851,782923,55171,7698%Mar_2011809,631917,293107,66212%Apr_2011845,6791,039,270193,59019%May_2011948,1041,154,912206,80818%Jun_20111,206,2611,353,181146,92111%Jul_20111,416,8291,464,05347,2243%Aug_20111,422,3271,538,980116,6538%Sep_20111,117,5261,247,934130,40810%Oct_2011997,7541,035,35237,5984%Nov_2011770,517909,573139,05615%Dec_2011784,449981,366196,91720%Total12,014,169 13,547,920 1,533,751 11% INVESTING IN A CLEAN FUTURE May 28, 2014 Austin Energy Load vs. Generation (2012) 4 INVESTING IN A CLEAN FUTURE May 28, 2014 Austin Energy Load vs. Generation (2013) 5 MonthAE GenerationAE LoadImbalanceImbalance %Jan_2013751,369 992,548241,179 24%Feb_2013643,377 818,125174,748 21%Mar_2013848,266 920,65072,384 8%Apr_2013834,519 939,671105,152 11%May_20131,030,170 1,108,38378,213 7%Jun_20131,184,552 1,300,091115,539 9%Jul_20131,230,540 1,337,525106,986 8%Aug_20131,290,192 1,413,634123,442 9%Sep_20131,053,989 1,247,015193,025 15%Oct_2013920,380 1,048,425128,045 12%Nov_2013738,485 953,639215,154 23%Dec_2013911,290 1,062,856151,566 14%Total11,437,127 13,142,562 1,705,434 13%