Item 5 - Briefing GHG Emissions — original pdf
Backup
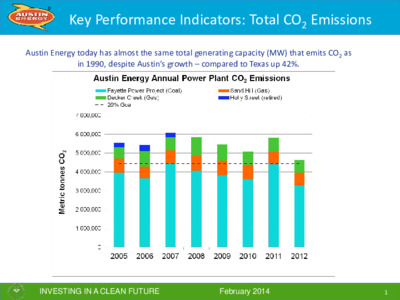
INVESTING IN A CLEAN FUTURE February 2014 Key Performance Indicators: Total CO2 Emissions Austin Energy today has almost the same total generating capacity (MW) that emits CO2 as in 1990, despite Austin’s growth – compared to Texas up 42%. 1 INVESTING IN A CLEAN FUTURE February 2014 Key Performance Indicators: Average CO2 per MWh Generation Austin Energy’s system average CO2 emissions rate has decreased 14% since 2005 due to renewable additions. It will continue to decrease as new wind resources come online. 2 INVESTING IN A CLEAN FUTURE February 2014 Key Performance Indicators: SO2 Emissions Austin Energy SO2 emissions, almost exclusively from the Fayette Power Project, decreased more than 95% beginning in 2011 when the scrubbers went online. SO2 also can contribute to acid rain and particulate matter pollution. 3 INVESTING IN A CLEAN FUTURE February 2014 Key Performance Indicators: NOx Emissions Austin Energy’s power plant NOx emissions decreased 75% between 2000 and 2012, lowering contribution to ozone-forming pollution. 4 INVESTING IN A CLEAN FUTURE February 2014 Emissions by Unit 5 CO2 emissions by unit in metric tonnes per year Unit 2005 2006 2007 2008 2009 2010 2011 2012 2013 Decker 1 236,913 402,737 272,360 431,130 321,558 258,481 284,459 218,698 111,251 Decker 2 308,434 367,785 349,898 515,441 520,480 437,046 413,055 416,677 217,787 Decker GT1 10,674 14,463 11,869 8,537 9,021 10,126 11,159 4,363 6,289 Decker GT2 9,351 12,707 20,200 15,080 8,276 7,499 13,104 5,177 7,880 Decker GT3 10,217 14,243 18,154 21,937 15,620 4,634 4,982 4,439 9,271 Decker GT4 8,449 18,381 13,936 16,536 9,655 7,198 15,102 5,143 7,137 Holly 3 96,983 150,007 132,229 0 0 0 0 0 0 Holly 4 143,786 159,755 113,840 0 0 0 0 0 0 SHEC 1 44,466 37,391 31,937 25,228 28,622 21,771 28,839 22,517 23,081 SHEC 2 44,449 36,794 22,309 40,589 22,656 31,927 30,068 28,571 33,028 SHEC 3 44,160 35,280 17,011 41,487 23,346 27,653 31,847 27,177 28,222 SHEC 4 43,657 28,900 38,747 33,320 25,438 29,627 28,575 24,952 22,736 SHEC 5 578,793 506,702 611,531 651,557 668,927 616,716 512,471 552,505 435,670 SHEC 6 0 0 0 10,077 19,544 15,729 28,329 SHEC 7 0 0 0 10,894 18,721 16,005 28,990 FPP 1 1,939,771 1,835,907 2,162,490 2,035,501 1,925,037 1,671,170 2,082,192 1,757,843 1,778,049 FPP 2 2,018,123 1,803,285 2,247,933 2,017,993 1,890,264 1,938,278 2,321,753 1,519,239 2,121,782 CO2 emissions by facility in metric tonnes per year Facility 2005 2006 2007 2008 2009 2010 2011 2012 2013 Decker Creek (Gas) 584,038 830,317 686,418 1,008,662 884,609 724,983 741,860 654,498 359,613 Holly Street (Retired) 240,769 309,762 246,069 0 0 0 0 0 0 Sand Hill (Gas) 755,526 645,066 721,535 792,182 768,988 748,663 670,065 687,455 600,057 Fayette Power Project (Coal) 3,957,894 3,639,192 4,410,423 4,053,494 3,815,301 3,609,448 4,403,946 3,277,082 3,899,831 Total 5,538,227 5,424,337 6,064,444 5,854,338 5,468,898 5,083,094 5,815,871 4,619,035 4,859,502 INVESTING IN A CLEAN FUTURE February 2014 More Emissions by Unit 6 Plant Emissions (English tons/year) Year Emission Decker Creek Power Station Sand Hill Energy Center Sub Total: AE's share of Fayette Power Plant: Sub Total: Total English Tons Unit 1 Unit 2 CY 2008 SO2 11 4 15 6,626 6,965 13,590 13,606 NOx 1,336 136 1,472 1,160 1,135 2,295 3,767 CO2 1,124,095 873,229 1,997,324 2,223,914 2,198,213 4,422,127 6,419,451 CY 2009 SO2 5 4 9 6,102 5,943 12,045 12,054 NOx 1,016 136 1,152 986 1,041 2,027 3,179 CO2 974,673 847,663 1,822,336 2,122,204 2,123,122 4,245,326 6,067,662 CY 2010 SO2 11 3 14 6,078 5,486 11,564 11,578 NOx 783 135 918 967 951 1,918 2,836 CO2 799,135 825,260 1,624,395 1,843,129 2,138,879 3,982,008 5,606,403 CY 2011 SO2 7 3 10 321 1,326 1,647 1,657 NOx 967 107 1,074 1,129 1,136 2,265 3,339 CO2 817,759 738,619 1,556,378 2,294,576 2,558,572 4,853,148 6,409,526 CY 2012 SO2 12 4 16 173 141 314 330 NOx 597 101 698 944 774 1,718 2,416 CO2 721,460 757,790 1,479,250 1,937,690 1,674,675 3,612,365 5,091,615