The City of Austin is committed to compliance with the American with Disabilities Act. Reasonable modifications and equal access to communications will be provided upon request. Meeting locations are planned with wheelchair access. If requiring Sign Language Interpreters or alternative formats, please give notice at least three days before the meeting to (512) 322-6087. TTY users route through Relay Texas at 711. AUSTIN GENERATION RESOURCE PLANNING TASK FORCE JUNE 11, 2014 9:30 AM AUSTIN CITY HALL – ROOM 1029 (STAFF BULLPEN) 301 W. SECOND STREET AUSTIN, TEXAS 78701 MEMBERS:Michael Osborne, Chair Barry Dreyling, Vice Chair Clay Butler Carol Biedrzycki Grace Hsieh Cyrus Reed Mike Sloan Tom “Smitty” Smith Michele Van Hyfte For more information: http://www.austintexas.gov/content/austin-generation-resource-planning-task-force AGENDA CALL TO ORDER – June 11, 2014 at 9:30 a.m. APPROVAL OF MINUTES 1. Approval of minutes of the May 29, 2014 and June 4, 2014 meetings. CITIZEN COMMUNICATION: GENERAL The first five speakers signed up prior to the meeting being called to order will each be allowed a three-minute allotment to address their concerns regarding items not posted on the agenda. STAFF BRIEFINGS 2. Briefing on green pricing and other voluntary programs 3. Presentation of quarterly financial reports 4. Briefing on the relicensing process for the South Texas Project 5. Presentation of greenhouse gas emissions reports 2005-2013 OLD BUSINESS 6. Discussion of past Austin Energy presentations regarding wholesale real time market purchases and net market purchases expressed as a percentage of Austin Energy load 7. Discussion of past Austin Energy presentations regarding present and future costs associated with each generation resource 8. Discussion of Austin Energy resources, peak demand and demand side resources 9. Discussion of Generation Plan scenarios 10. Discussion of competitive issues and other obstacles to the Task Force. The City of Austin is committed to compliance with the American with Disabilities Act. Reasonable modifications and equal access to communications will be provided upon request. Meeting locations are planned with wheelchair access. If requiring Sign Language Interpreters or alternative formats, please give notice at least three days before the meeting to (512) 322-6087. TTY users route through Relay Texas at 711. NEW BUSINESS 11. Discussion regarding the Task Force report outline, format and timing 12. Discussion and possible action regarding Task Force report recommendations FUTURE AGENDA ITEMS 13. Discussion regarding future agenda items, including a schedule of topics, and issues raised during briefings and Citizen Communications during this meeting ADJOURNMENT
Page 1 of 2 AUSTIN GENERATION RESOURCE PLANNING TASK FORCE MEETING MINUTES JUNE 11, 2014 The Austin Generation Resource Planning Task Force (‘the Task Force’) convened in a meeting at Austin City Hall, Room 1029, 301 West Second Street, Austin, Texas. CALL TO ORDER – Michael Osborne called the meeting to order at 9:37 a.m. Task Force members in attendance: Carol Biedrzycki, Clay Butler, Barry Dreyling, Michael Osborne, Cyrus Reed and Mike Sloan. Tom “Smitty” Smith called in to listen. Michele Van Hyfte and Grace Hsieh were absent. APPROVAL OF MINUTES 1. Approval of minutes of the May 29, 2014 and June 4, 2014 meetings. Motion to approve May 29, 2014 minutes (Biedrzycki); seconded (Reed); approved on a vote of 6-0 (with Smith off the dais and Van Hyfte and Hsieh absent). Motion to approve June 4, 2014 minutes (Dreyling); seconded (Reed); approved on a vote of 6-0 (with Smith off the dais and Van Hyfte and Hsieh absent). CITIZEN COMMUNICATION: GENERAL The following persons addressed the Task Force: • Al Braden – no coal; more electric vehicles • Karen Hadden – as citizen, not Electric Utility Commissioner; look at replacement power to replace South Texas Project as of 2024 • Susan Lippman – no coal • Kaiba White – eliminate carbon/GHG emissions STAFF BRIEFINGS 2. Briefing on green pricing and other voluntary programs by Austin Energy’s Liz Jambor, Manager, Customer Energy Solutions and Pat Sweeney, Acting VP Finance 3. Presentation of quarterly financial reports – no discussion 4. Briefing on the relicensing process for the South Texas Project by Austin Energy’s Elaina Ball, VP Power Production 5. Presentation of greenhouse gas emissions reports 2005-2013 by Austin Energy’s Matt Russell, Manager, Environmental Services OLD BUSINESS 6. Discussion of past Austin Energy presentations regarding wholesale real time market purchases and net market purchases expressed as a percentage of Austin Energy load – Babu Chakka, Energy Market Operations responded to questions regarding the answers/charts/graphs Austin Energy provided in response to prior Task Force requests for information and questions submitted. Page 2 of 2 7. Discussion of past Austin Energy presentations regarding present and future costs associated with each generation resource – No discussion. 8. Discussion of Austin Energy resources, peak demand and demand side resources – No discussion. 9. Discussion of Generation Plan scenarios – No discussion. 10. Discussion of competitive issues and other obstacles to the Task Force – No discussion …
JUNE 11, 2014 ITEM 12 Carol Biedrzycki CONCEPTS FOR REACHING THE UNDERSERVED AND HAVING THEM BENEFIT FROM ENERGY EFFICIENCY AND SOLAR PROGRAMS On Monday June 2, 2014 Carol Biedrzycki, Kaiba White and Kristian Caballero met to discuss alternatives for improving the ability of Austin Energy’s underserved residential customers to lower their utility costs through energy efficiency and renewable energy program. Note that both individuals spoke at the May 29, 2014 Task Force meeting held to receive public comment. Austin Energy and the City need to take deliberate steps to reach its goal for net zero energy growth and achieve many energy efficiency savings that will lower the bills of households paying an above average percentage of their income for electricity. The following are concepts the city should thoroughly explore in order to increase the amount of energy efficiency achieved in the homes of underserved residential customers: Payment of incentives on an income based sliding scale. The concept of a sliding scale of incentives can be applied to every Austin Energy residential program offering 100% to those below 200% of the Federal Poverty Guideline-(FPG) and reducing the percent of the incentive as income increases with the highest income groups being eligible for 0%. Neighborhood based energy efficiency programs. Conduct energy efficiency programs that are geographically targeted to underserved neighborhoods in the city. Preferably this should be a joint effort with Neighborhood Housing to maximize the number of homes retrofitted. It is not uncommon for homes to be disqualified for energy efficiency improvements because of a significant need for ancillary repairs. Having a remedy for the needed home repairs will help the families the most and maximize the energy saving benefits of the program. Combined community and city resources to effectively deliver programs (e.g. single point of contact), locate the underserved (e.g. door-to-door outreach) and deliver energy efficiency and renewable energy program benefits to them. Creation of a consumer committee to make recommendations to Austin Energy and City Council regarding development and design of energy efficiency and renewable energy programs for underserved residential consumers.
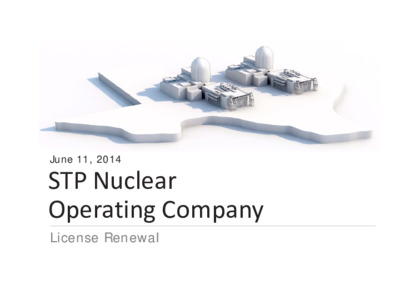
STP Nuclear Operating Company June 11, 2014 License Renewal 1 Overview Generating capacity of approximately 2,700 MWs, the state-of-the-art facility is one of the nation’s newest, largest nuclear plants Large, dual-unit pressurized water reactor facility Westinghouse 4 loop technology Located on a 12,200-acre site on the Colorado River 7,000-acre, above grade, off-channel, main cooling reservoir, sized for four units Commercial operation began in August, 1988 and June, 1989, respectively 2 Company Structure Ownership Structure 44% NRG Energy 40% CPS Energy (San Antonio) 16 % Austin Energy Operated by STP Nuclear Operating Company Non-stock, non-profit, non-member corporation NRC license 40 year licenses, expiring in 2027 and 2028 Applied for 20 year renewal in October 2010 3 Current Status The Atomic Energy Act of 1954 permits nuclear plants to renew operating licenses License renewal application submitted to NRC in October 2010 Received the Final Safety Evaluation Report (Feb. 2013) All applications held in abeyance while NRC adjudicates Waste Confidence Ruling NRC resolution of Waste Confidence Ruling is on track for October 2014. The NRC conducts a rigorous review during the license renewal process Nuclear energy facilities in the United States are initially licensed to operate for 40 years 4 Background NRC’s renewal review is a detailed process that typically takes 30 months NRC has renewed 73 operating licenses of 100 power reactors with 18 more in review STP developed the License Renewal Application in collaboration with the Strategic Alliance and Resource Sharing partnership, a group of seven nuclear facilities
June 4, 2014 June 4, 2014 Austin Energy Update to Austin Generation Resource Planning Task Force Babu Chakka - Manager, Energy Market Analysis INVESTING IN A CLEAN FUTURE June 4, 2014 Agenda •Austin Energy All in historical production cost/revenue for Gas with Natural Gas Risk Management •Back cast of recent Solar contract •Renewable cost assumptions for Resource Planning 3 INVESTING IN A CLEAN FUTURE June 4, 2014 Austin Energy All in Production Cost/Revenue for Gas units 4 $0$20$40$60$80$100$120$140Millions of Dollars (M$)Total Natural Gas GenerationNatural Gas Risk ManagementNon-Fuel CostFuel CostMarket RevenueGenerationMWhFuel Cost($Million)Non-Fuel Cost($Million)Total Cost($Million)Total Cost($/MWH)Total Revenue ($Million)Total Revenue ($/MWH)Natural Gas Risk Management Cost ($Million)Net Revenue/Cost without Risk Management ($Million)Net Revenue/Cost without Risk Management ($/MWH)Net Revenue/Cost with Risk Management ($Million)Net Revenue/Cost with Risk Management ($/MWH)CY 20111,760,176$116.3$28.6$144.8$82.28$242.7 $137.87 $48.12 $97.8 $55.59$49.7 $28.26CY 20121,388,101$75.0$33.7$108.7$78.32$94.3 $67.95 $66.61 ($14.4)($10.37)($81.0)($58.36)SummaryNote: Risk Management cost is a cost associated with load and has nothing to do with Generation INVESTING IN A CLEAN FUTURE June 4, 2014 Back Cast Analysis Assumptions •Based upon hourly profile provided by the proposer –Same for both 2011 & 2012 •Revenues are based on AE Load Zone LMP •Does not include any congestion cost, contract sharing cost etc., in the analysis 5 INVESTING IN A CLEAN FUTURE June 4, 2014 Back cast of West Texas Solar (Recent Solar Contract) 6 $0.0$2.0$4.0$6.0$8.0$10.0$12.0Millions of Dollars (M$)Back Cast West Texas SolarPPA Cost @ 48 $/MWHPPA Cost @ 55 $/MWHMarket RevenueGenerationMWhPPA Cost @ 48 $/MWH($Million)PPA Cost @ 55 $/MWH($Million)Total Revenue ($Million)Net Revenue @ 48/MWH($ Million)Net Revenue @ 55/MWH($ Million)Net Revenue/Cost @ 48/MWH($ /MWH)Net Revenue/Cost @ 55/MWH($ /MWH)CY2011436,235$20.9$24.0$26.9 $6.0 $2.9$13.66$6.66CY 2012436,235$20.9$24.0$13.6 ($7.3)($10.4)($16.73)($23.73) INVESTING IN A CLEAN FUTURE June 4, 2014 Projected Production Cost for Wind 7 Other costs such as Congestion cost & contract sharing cost are not included here Includes all existing wind resources that are currently in commercial operation or become available in the planning period $38.21$33.91$34.29$34.56$34.67$34.80$34.88$34.99$35.11$32.70$32.86$0.00$5.00$10.00$15.00$20.00$25.00$30.00$35.00$40.00$45.00Austin Energy Wind Cost ($/MWh) INVESTING IN A CLEAN FUTURE June 4, 2014 Utility Scale Solar Cost Assumptions for Resource Planning 8 020406080100120140160Levelized Cost ($/MWH)Utility Scale Solar (West Texas) Base Cost Assumptions ($/MWh)Base Cost Assumptions without PTC/ITC ($/MWh)High Cost Assumptions ($/MWh)Low Cost Assumptions ($/MWh)Low Cost Assumptions without PTC/ITC ($/MWh)Note: 1.2015 cost range with PTC/ITC generally based on recent Austin Energy Bids 2.Solar PV assumed flat through 2017 (i.e. cost decreases at about general inflation rate of 2.1%) then increases at 2.1% general inflation through 2025 3.Wind cost assumptions escalated at general inflation …
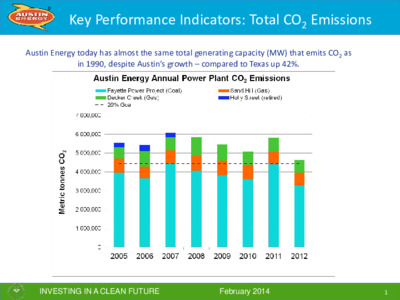
Austin EnergyAustin EnergyFinancial Updatep3rd Quarter ended June 30, 20101 2010 Q3 Financial Results($ millions)Amended Budget2009-10CYE2009-10AllotmentQ3 FY 10Actual Q3FY 10DifferenceActual to AllotmentBeginning Balance$174.8 $237.3$174.8$237.3$62.5 Revenue$1,242.3 $1,194.7$856.8$783.5 ($73.3) Transfers In2.0 2.02.0 2.00.0Total Available Funds$1,244.3 $1,196.7$858.8 $785.5 ($73.3) Operating Operating Requirements928.8 888.5674.9621.6 53.3Debt Service178.6 171.2111.6 106.5 5.1Tf Ot2050205016481649(01)Transfers Out205.0205.0164.8164.9(0.1)Total Requirements$1,312.4 $1,264.7$951.3$893.0 $58.3Excess(Deficiency)(681)(680)(925)(1075)(150)Excess(Deficiency)(68.1)(68.0)(92.5)(107.5)(15.0)Ending Balance$106.7 $169.4$82.3 $129.8$47.52 2010 Q3 Revenue Highlights8,427 8,234 8,324 8,320 8,000 10,000 $1,000$1,250$8068$856.8Total Revenue (in millions) & Billed GWh Sales$8082$413.0$403.1$405.4$404.6$260.9 $305.3 $291.5 $348.7 $134.3 $98.4 $86.6 $103.5 2,000 4,000 6,000 $250$500$750GWh$806.8$783.5$808.2SiABNflR$$$$-$0FY 2008 YTD Q3 2009 YTD Q32010 YTD Q32010 YTD Q3 EstimateBase Revenue ( in Millions)Fuel RevenueOther RevenueBilled GWh SalesService Area Base or Non-fuel Revenue•49% of total revenue or $603.6 million annual budget•$405.4 million Q3 exceeds budget allotment by $0.8 million and $2.3 million over same period prior yearFuel Revenue $57.2 million below budget allotment•39% of total revenue or $480.3 million annual budget•$291.5 million Q3 below budget allotment by $57.2 million and $13.3 million lower than same period prior yearBilled sales at 8,324.0 gigawatt hours (GWh)•89.7 GWh higher than FY 2009 Q3 actual of 8,234.33 2010 Revenue Q3 and CYECategoryQ3 Current Q3 PriorQ3 Current vs. PriorAmended Budget Year End EstimateEstimate vs. BudgetServiceAreaBaseService Area Base Revenue405,420,061$ 403,097,084$ 2,322,977$ 603,577,198$ 613,345,143$ 9,767,945$ Fuel & Green Choice Revenue291,518,838305,310,177(13,791,339)480,298,920440,522,623(39,776,297)Transmission Service Revenue43,636,58742,629,8981,006,68957,620,70957,620,7090Other Revenue36,953,88444,799,117(7,845,233)90,282,61776,270,887(14,011,730)Interest Income5,938,44210,965,743(5,027,301)10,479,9996,944,097(3,535,902)783467812$806802019$(23334207)$1242259443$1194703459$(47555984)$Total Revenue783,467,812$ 806,802,019$ (23,334,207)$ 1,242,259,443$ 1,194,703,459$ (47,555,984)$ Transfers In2,000,00043,215,000(41,215,000)2,000,0002,000,00004Total Available Funds785,467,812$ 850,017,019$ (64,549,207)$ 1,244,259,443$ 1,196,703,459$ (47,555,984)$ 2010 Q3 Requirements HighlightsTotal Operating Requirements in (millions)$3088$2955$347.3$750$1,000$1,250$906.0$893.0$951.2$821.4$276.1$302.3$326.1$327.8$285.5$308.8$295.5$347.3$259.8$294.9$271.4$276.1$0$250$500$750Total Requirements $59.8 million under budget allotment$0FY 2008 Q3FY 2009 Q3FY 2010 Q3 ActualFY 2010 Q3 EstimatedNon-Fuel RequirementsTransfers OutFuel○Fuel costs $51.8 million lower due to commodity pricing○Non-fuel costs $3.0 million lower than budget allotmentConservation rebates above allotment due to high demandConservation rebates above allotment due to high demandQ2 unplanned nuclear outage increased operating costsBudget savings in other operating areas○Debt Service $5.1 million lower than budget allotment•Issued less commercial paper than planned5 2010 Requirements Q3 and CYECategoryQ3 Current Q3 PriorQ3 Current vs. PriorAmended Budget Year End EstimateEstimate vs. BudgetFuel Expense295,471,086$ 308,763,797$ 13,292,711$ 501,298,920$ 462,222,623$ 39,076,297$ Non-Fuel O&M166,946,360166,805,404(140,956)231,694,730228,426,6353,268,095Transmission Service 46,104,10842,999,214(3,104,894)63,938,86663,938,8660Conservation6,145,1286,236,48691,3589,901,9409,161,188740,752ConservationRebatesConservation Rebates & Incentives12,744,72510,560,193(2,184,532)15,796,47417,398,188(1,601,714)Nuclear & Coal Plants O&M74,414,61660,842,911(13,571,705)81,060,47181,031,99128,480Other Operating Requirements20,031,80814,886,309(5,145,499)25,405,62226,605,889(1,200,267)TotalOperatingTotal Operating Requirements621,857,831611,094,314(10,763,517)929,097,023888,785,38040,311,643Debt Service 106,482,196115,098,8188,616,622178,586,493171,172,1717,414,322Transfer to Electric CIP44,952,638103,287,79358,335,15559,710,00059,710,0000General Fund Transfer75,750,00071,250,000(4,500,000)101,000,000101,000,0000Other Transfers44,000,0005,302,849(38,697,151)44,000,00044,000,0000Total Department Expenditures893,042,665$ 906,033,774$ 12,991,109$ 1,312,393,516$ 1,264,667,551$ 47,725,965$ 6 Questions?7 Austin EnergyAustin EnergyFinancial UpdatepYear Ended September 30, 20101stQuarter Fiscal Year 20111Quarter Fiscal Year 20111 Austin Energy –2010 Highlights•Year of Transition –New General Manager September 27•Major AccomplishmentsEnergyResourcePlanto2020approvedpendingaffordabilitytool•Energy Resource Plan to 2020 approved pending affordability tool •Sand Hill Energy Center 100 MW peaking capacity online •Maintained …