Agenda Item 2a1_AARC Performance Measures — original pdf
Backup
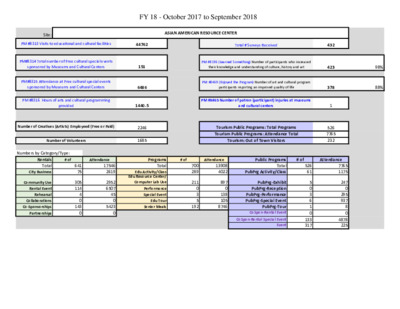
Site: PM #8313 Visits to educaitonal and cultural facilities PM#8314 Total number of Free cultural special events sponsored by Museums and Cultural Centers PM#8315 Attendance at Free cultural special events sponsored by Museums and Cultural Centers PM #8316 Hours of arts and cultural programming provided Number of Creatives (Artists) Employeed (Free or Paid) ASIAN AMERICAN RESOURCE CENTER Total # Surveys Received PM #8196 (Learned Something) Number of participants who increased their knowledge and understanding of culture, history and art PM #8469 (Enjoyed the Program) Number of art and cultural program participants reporting an improved quality of life PM #8465 Number of patron (participant) Injuries at museums and cultural centers Tourism Public Programs: Total Programs Tourism Public Programs: Attendance Total Tourism: Out of Town Visitors 432 423 378 1 526 7765 232 44762 151 6486 1440.5 2246 1685 98% 88% Attendance # of Attendance # of Attendance Number of Volunteers Numbers by Category/Type: # of Rentals Total City Business Community Use Rental Event Rehearsal Collaborations Co‐Sponsorships Partnerships 641 75 305 114 4 0 143 0 Programs Total Edu Activity/Class Edu Resource Center/ Computer Lab Use Performance Special Event Edu Tour Senior Meals 17546 2619 2952 6507 45 0 5423 0 700 289 211 0 3 5 192 13908 4022 897 0 138 105 8746 Public Programs Total PubPrg Activity/Class PubPrg‐Exhibit PubPrg‐Reception PubPrg‐Performance PubPrg‐Special Event PubPrg‐Tour CoSpon‐Rental Event CoSpon‐Rental Special Event Event 526 61 5 0 3 6 1 0 133 317 7765 1175 247 0 295 937 8 0 4878 225 99% 94% 20 0% PM #8313 Visits to educational and cultural facilities 10389 SITE Asian American Resource Center SURVEYS Total Number of Surveys Received PM #8196 (Learned Something) Number of participants who increased their knowledge and understanding of culture, history and art PM #8469 (Enjoyed the Program) Number of art and cultural program participants reporting an improved quality of life TOTAL ATTENDANCE Total Daily Drop‐In Visitors PM #8315 Attendance at Free cultural special events sponsored by Museums and Cultural Centers (Taken from total Visits to edu & Cultural facilities) Total Number of Out of Town Visitors (Taken from total Visits to edu & Cultural facilities) Total Number of Out of Town Visitors (Taken from total Daily Visits to edu & Cultural facilities) TOTAL NUMBER OF PROGRAMS & EVENTS Total number of programs and events held at Museums and Cultural Centers PM #8314 Total number of Free cultural special events sponsored by Museums and Cultural Centers Total number of Tourism Programs & Events sponsored by Museums and Cultural PM #8316 Hours of arts and cultural programming provided TOTAL PROGRAM HOURS PM #8465 Number of patron (participant) Injuries at museums and cultural centers Number of facility incidents at museums and cultural centers (Reported in TOTAL INCIDENTS & INJURIES Number of Creatives (Artists) Employeed (Free or Paid) Number of Volunteers TOTAL ARTISTS SERVED & VOLUNTEERS TOTAL PROGRAMS & ATTENDANCE BY CATEGORIES Total Programs 10262 127 1022 20 0 347 5 5 268 265 251 341 0 3 723 322 Activity/Class Resource Center/ Computer Lab Use Performance Special Event Tour Senior Meals Exhibit Reception Rehearsal Rental Event City Business Community Use Collaborations CoSponsorships Total Attendance 1908 178 125 894 0 2075 66 15 67 3850 272 812 1042 649 99 59 1 3 0 44 1 1 6 57 8 68 14 19 10262 19% 2% 1% 9% 0% 20% 1% 0% 1% 38% 3% 8% 99% 98% 94 0% SITE Asian American Resource Center SURVEYS Total Number of Surveys Received PM #8196 (Learned Something) Number of participants who increased their knowledge and understanding of culture, history and art PM #8469 (Enjoyed the Program) Number of art and cultural program participants reporting an improved quality of life 809 797 794 PM #8313 Visits to educational and cultural facilities 44748 TOTAL ATTENDANCE Total Daily Drop‐In Visitors PM #8315 Attendance at Free cultural special events sponsored by Museums and Cultural Centers (Taken from total Visits to edu & Cultural facilities) Total Number of Out of Town Visitors (Taken from total Visits to edu & Cultural facilities) Total Number of Out of Town Visitors (Taken from total Daily Drop‐In Visits to edu & Cultural facilities) TOTAL NUMBER OF PROGRAMS & EVENTS Total number of programs and events held at Museums and Cultural Centers PM #8314 Total number of Free cultural special events sponsored by Museums and Cultural Centers Total number of Tourism Programs & Events sponsored by Museums and Cultural Centers PM #8316 Hours of arts and cultural programming provided TOTAL PROGRAM HOURS PM #8465 Number of patron (participant) Injuries at museums and cultural centers Number of facility incidents at museums and cultural centers (Reported in TOTAL INCIDENTS & INJURIES Number of Creatives (Artists) Employeed (Free or Paid) Number of Volunteers TOTAL ARTISTS SERVED & VOLUNTEERS TOTAL PROGRAMS & ATTENDANCE BY CATEGORIES Total Programs 42986 1762 3604 89 5 1568 23 18 2006.75 6 16 2743 2198 Activity/Class Resource Center/ Computer Lab Use Performance Special Event Tour Senior Meals Exhibit Reception Rehearsal Rental Event City Business Community Use Collaborations CoSponsorships Partnerships Total Attendance 7040 872 562 3342 0 6952 146 0 83 17276 2949 3499 1590 1962 78 409 243 8 30 0 187 3 0 3 316 70 298 23 160 24