Annual HOT Tax Handout May 2, 2017 — original pdf
Backup
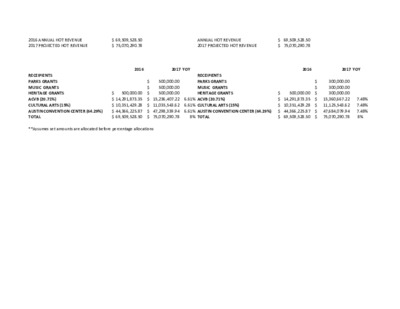
2016 ANNUAL HOT REVENUE69,509,528.50$ ANNUAL HOT REVENUE69,509,528.50$ 2017 PROJECTED HOT REVENUE75,070,290.78$ 2017 PROJECTED HOT REVENUE75,070,290.78$ 20162017YOY20162017YOYRECEIPIENTSRECEIPIENTSPARKS GRANTS500,000.00$ PARKS GRANTS300,000.00$ MUSIC GRANTS500,000.00$ MUSIC GRANTS300,000.00$ HERITAGE GRANTS500,000.00$ 500,000.00$ HERITAGE GRANTS500,000.00$ 300,000.00$ ACVB (20.71%)14,291,873.35$ 15,236,407.22$ 6.61%ACVB (20.71%)14,291,873.35$ 15,360,667.22$ 7.48%CULTURAL ARTS (15%)10,351,429.28$ 11,035,543.62$ 6.61%CULTURAL ARTS (15%)10,351,429.28$ 11,125,543.62$ 7.48%AUSTIN CONVENTION CENTER (64.29%)44,366,225.87$ 47,298,339.94$ 6.61%AUSTIN CONVENTION CENTER (64.29%)44,366,225.87$ 47,684,079.94$ 7.48%TOTAL69,509,528.50$ 75,070,290.78$ 8%TOTAL69,509,528.50$ 75,070,290.78$ 8%**Assumes set amounts are allocated before percentage allocations Data compiled from Texas Comptroller of Public Accounts by Catlin Whitington as of 4/27/2017 $- $200,000,000.00 $400,000,000.00 $600,000,000.00 $800,000,000.00 $1,000,000,000.00 $1,200,000,000.00 1995 1996 1997 1998 1999 2000 2001 2002 2003 2004 2005 2006 2007 2008 2009 2010 2011 2012 2013 2014 2015 2016 2017 HOT Taxable Revenue for Austin Properties Annual, 1995 - 2016 5-year average annual growth: 12% 10-year average annual growth: 8% 20-year average annual growth: 8% *2017 data assumes 8% annual growth