Late Backup - Survey Demographics Comparison — original pdf
Backup
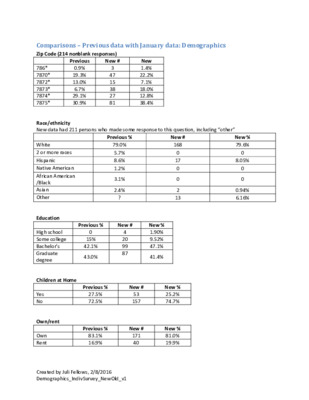
Created by Juli Fellows, 2/8/2016 Demographics_IndivSurvey_NewOld_v1 Comparisons – Previous data with January data: Demographics Zip Code (214 nonblank responses) Previous New # New 786* 0.9% 3 1.4% 7870* 19.3% 47 22.2% 7872* 13.0% 15 7.1% 7873* 6.7% 38 18.0% 7874* 29.1% 27 12.8% 7875* 30.9% 81 38.4% Race/ethnicity New data had 211 persons who made some response to this question, including “other” Previous % New # New % White 79.0% 168 79.6% 2 or more races 5.7% 0 0 Hispanic 8.6% 17 8.05% Native American 1.2% 0 0 African American /Black 3.1% 0 0 Asian 2.4% 2 0.94% Other ? 13 6.16% Education Previous % New # New % High school 0 4 1.90% Some college 15% 20 9.52% Bachelor’s 42.1% 99 47.1% Graduate degree 43.0% 87 41.4% Children at Home Previous % New # New % Yes 27.5% 53 25.2% No 72.5% 157 74.7% Own/rent Previous % New # New % Own 83.1% 171 81.0% Rent 16.9% 40 19.9%