Item 4a Community Presentation — original pdf
Backup
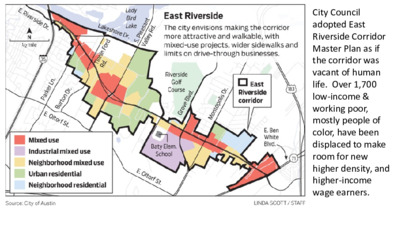
City Council adopted East Riverside Corridor Master Plan as if the corridor was vacant of human life. Over 1,700 low-income & working poor, mostly people of color, have been displaced to make room for new higher density, and higher-income wage earners. Your text here12 Blocks had negative changes. No areas with over 100% change. 18 areas had positive changes of these 6 areas were over 100% ERC per capita income increased significantly between 2010 & 2017. Per capita income for Whites increased 20% while per capita income for Latinos increased 9% ERC per capita income increased significantly between 2010 & 2017. Per capita income for Whites increased 20% while per capita income for Latinos increased 9% Growth in the East Riverside Corridor has largely been the result of the in-migration of educated, young-adult, and higher-income Whites, who live alone or who live with other unrelated individuals. This population is also likelier to be renters than homeowners.Latinos have maintained the greatest share of the population in the Corridor since 2000 (ERCMP 2010 A8). It is important to note that demographic trends at the time of the Master Plan adoption suggested that the population growth in the Corridor would primarily originate from growth in the Latino population and that White and Asian populations would be a “source of growth due to migration into the Corridor” (ERCMP 2010A*). The findings suggest that the growth in the East Riverside Corridor is primarily the result of White in-migration.We must identify policy changes that will improve the quality of life for current and vulnerable residents.