Customer Energy Solutions FY 26 Savings Report — original pdf
Backup
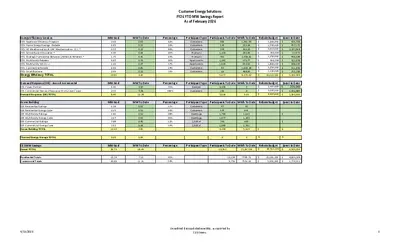
Customer Energy Solutions FY26 YTD MW Savings Report As of February 2026 Energy Efficiency Services EES- Appliance Efficiency Program EES- Home Energy Savings - Rebate EES- AE Weatherization & CAP Weatherization - D.I. * EES- School Based Education * EES- Strategic Partnership Between Utilities & Retailers * EES- Multifamily Rebates EES- Multifamily WX-D.I.+ EES- Commercial Rebate EES- Small Business Energy Efficiency TOTAL Demand Response (DR) - Annual Incremental DR- Power Partner DR- Commercial Demand Response (frmly Load Coop) Demand Response (DR) TOTAL Green Building GB- Residential Ratings GB- Residential Energy Code GB- Multifamily Ratings GB- Multifamily Energy Code GB- Commercial Ratings GB- Commercial Energy Code Green Building TOTAL MW Goal 2.00 0.65 0.55 0.30 1.75 0.65 1.00 6.00 2.00 14.90 MW Goal 6.40 2.00 8.40 MW Goal 0.29 2.15 1.90 2.67 3.89 2.53 13.43 MW To Date 0.63 0.15 0.22 0.06 0.41 0.23 0.37 0.81 0.32 3.20 MW To Date 4.50 7.78 12.28 MW To Date 0.03 0.53 0.52 0.93 0.45 0.49 2.95 Thermal Energy Storage TOTAL 0.00 0.00 Percentage 32% 23% 39% 20% 23% 36% 37% 14% 16% Participant Type Customers Customers Customers Products Products Apartments Apartments Customers Customers Participants To Date MWh To Date 981 145 249 1,309 461 1,291 1,630 43 29 5,677 1,361.69 222.28 409.23 293.85 3,458.91 672.77 654.50 1,832.39 468.00 9,373.62 Rebate Budget $ 1,200,000 $ 1,550,000 $ 5,613,500 $ 350,000 $ 1,250,000 $ 900,000 $ 1,800,000 $ 2,250,000 $ 1,100,000 $ 16,013,500 Spent to Date $ 425,309 $ 457,171 $ 2,297,808 $ 67,073 $ 456,089 $ 321,638 $ 598,195 $ 511,836 $ 255,290 $ 5,390,409 Percentage 70% 389% Participant Type Devices Customers Participants To Date MWh To Date 3,446 190 3,636 0 0 0.00 Rebate Budget $ 2,497,600 $ 2,000,000 $ 4,497,600 Spent to Date $ 201,045 $ 1,002,885 $ 1,203,930 Percentage 11% 24% 28% 35% 12% 19% Participant Type Customers Customers Dwellings Dwellings 1,000 sf 1,000 sf Participants To Date MWh To Date Rebate Budget Spent to Date 47 635 1,790 1,977 743 1,985 4,449 0 32 641 1,623 1,262 605 1,761 5,924 0 $ - $ - $ - $ - $ - $ - CES MW Savings Grand TOTAL Residential Totals Commercial Totals MW Goal 36.73 MW To Date 18.43 Percentage Participant Type Participants To Date MWh To Date 13,762 15,297.89 Rebate Budget $ 20,511,100 Spent to Date $ 6,594,339 15.74 20.99 7.13 11.31 45% 54% 10,194 6,756 7745.73 7552.16 $ $ 15,161,100 5,350,000 $ $ 4,824,328 1,770,011 4/13/2026 Unaudited data updated monthly, as reported by CES teams. 3 Customer Energy Solutions FY26 YTD MW Savings Report As of February 2026 Customer Renewable Solutions Residential Commercial Unincentivized Solar Energy TOTAL GreenChoice Residential Commercial GreenChoice TOTAL Community Solar Market Rate CAP Community Solar TOTAL Energy Efficiency Programs Customer Renewable Solutions (Solar/Community Solar/GreenChoice) Green Building Participants To Date MWh To Date Incentive Budget $ 2,500,000 $ 2,750,000 Spent to Date 670,000 1,395,826 268 15 62 345 4,027 5,096 1,992 9,123 $ 5,250,000 $ 2,065,826 MW Goal 5.00 7.00 10.00 22.00 MW To Date 2.26 2.90 4.45 9.60 Percentage 45% 41% Participant Type Customers Customers Participant Type Customers Customers Participant Type Customers Customers January Participants 20,376 428 20,804 January Participants 205 187 392 January MWh 14,495.61 51,995.40 66,491.01 January MWh 153.17 164.19 317.36 Through January, 77% Single Family homes and 2 multifamily development (with a total of 594 units) receiving AEGB ratings are in SMART Housing developments in the AE service area. Notes: AE Weatherization budget excludes rollover. All numbers are unaudited and will be adjusted in line with financial updates. This report has historically been filtered by paid date per enrollment. Beginning June 2022 the EES data is filtered on payment authorization (approval) date. 4/13/2026 Unaudited data updated monthly, as reported by CES teams. 3 Customer Energy Solutions FY26 YTD MW Savings Report As of February 2026 MW Saving Goal Tracking Solar Goal Tracking 40.00 35.00 30.00 25.00 20.00 15.00 13.47 11.87 14.82 10.00 5.00 0.00 18.43 9.42 36.731 8.00 7.00 6.00 5.00 4.00 3.00 2.00 1.00 0.00 2.89 2.90 2.26 1.64 1.79 0.88 0.52 0.45 0.17 0.19 7.000 5.000 Oct Nov Dec Jan Feb Mar Actual Apr Goal May Jun Jul Aug Sep Oct Nov Dec Jan Feb Mar Apr May Jun Jul Aug Sep Res Actual Com Actual Res Goal Com Goal 4/13/2026 Unaudited data updated monthly, as reported by CES teams. 3