Customer Energy Solutions FY 26 Savings Report — original pdf
Backup
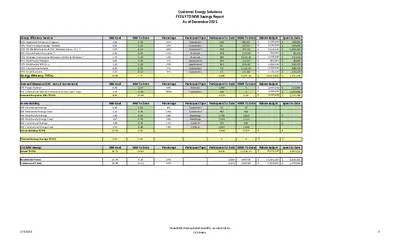
Customer Energy Solutions FY26 YTD MW Savings Report As of December 2025 Energy Efficiency Services EES- Appliance Efficiency Program EES- Home Energy Savings - Rebate EES- AE Weatherization & CAP Weatherization - D.I. * EES- School Based Education * EES- Strategic Partnership Between Utilities & Retailers * EES- Multifamily Rebates EES- Multifamily WX-D.I.+ EES- Commercial Rebate EES- Small Business Energy Efficiency TOTAL Demand Response (DR) - Annual Incremental DR- Power Partner DR- Commercial Demand Response (frmly Load Coop) Demand Response (DR) TOTAL Green Building GB- Residential Ratings GB- Residential Energy Code GB- Multifamily Ratings GB- Multifamily Energy Code GB- Commercial Ratings GB- Commercial Energy Code Green Building TOTAL MW Goal 2.00 0.65 0.55 0.30 1.75 0.65 1.00 6.00 2.00 14.90 MW Goal 6.40 2.00 8.40 MW Goal 0.29 2.15 1.90 2.67 3.89 2.53 13.43 MW To Date 0.43 0.10 0.14 0.03 0.24 0.04 0.22 0.40 0.17 1.77 MW To Date 2.67 7.78 10.45 MW To Date 0.02 0.40 0.52 0.74 0.45 0.46 2.60 Thermal Energy Storage TOTAL 0.00 0.00 Percentage 21% 15% 26% 11% 14% 5% 22% 7% 9% Participant Type Customers Customers Customers Products Products Apartments Apartments Customers Customers Participants To Date MWh To Date 640 91 168 768 386 256 923 24 15 2,885 891.95 142.01 271.30 172.38 3,014.36 111.50 529.36 1,162.67 271.86 6,567.39 Rebate Budget $ 1,200,000 $ 1,550,000 $ 5,613,500 $ 350,000 $ 1,250,000 $ 900,000 $ 1,800,000 $ 2,250,000 $ 1,100,000 $ 16,013,500 Spent to Date $ 258,956 $ 294,600 $ 1,494,463 $ 39,352 $ 371,922 $ 49,866 $ 400,307 $ 288,759 $ 153,215 $ 3,351,440 Percentage 42% 389% Participant Type Devices Customers Participants To Date MWh To Date 1,883 190 2,073 0 0 0.00 Rebate Budget $ 2,497,600 $ 2,000,000 $ 4,497,600 $ $ $ 112,895 1,002,885 1,115,780 Percentage 8% 19% 28% 28% 12% 18% Participant Type Customers Customers Dwellings Dwellings 1,000 sf 1,000 sf Participants To Date MWh To Date Rebate Budget Spent to Date 37 487 1,790 1,654 743 1,857 3,968 0 23 492 1,623 1,122 605 1,648 5,514 0 $ - $ - $ - $ - $ - $ - CES MW Savings Grand TOTAL Residential Totals Commercial Totals MW Goal 36.73 MW To Date 14.82 Percentage Participant Type Participants To Date MWh To Date 8,926 12,081.41 Rebate Budget $ 20,511,100 Spent to Date $ 4,467,221 15.74 20.99 4.30 10.52 27% 50% 5,639 6,273 5647.56 6433.84 $ $ 15,161,100 5,350,000 $ $ 3,022,361 1,444,859 2/9/2026 Unaudited data updated monthly, as reported by CES teams. 3 Customer Energy Solutions FY26 YTD MW Savings Report As of December 2025 Participants To Date MWh To Date Incentive Budget $ 2,500,000 $ 2,750,000 Spent to Date 267,500 1,029,383 107 10 36 153 1,649 2,877 1,922 4,526 $ 5,250,000 $ 1,296,883 MW Goal 5.00 7.00 10.00 22.00 Participant Type Customers Customers Participant Type Customers Customers MW To Date 0.88 1.64 1.46 3.98 Participants 20,100 430 20,530 Participants 203 197 400 Percentage 18% 23% Participant Type Customers Customers MWh 12,164.77 50,955.75 63,120.52 MWh 133.04 140.91 273.95 Through December, 70% Single Family homes and 2 multifamily development (with a total of 594 units) receiving AEGB ratings are in SMART Housing developments in the AE service area. Customer Renewable Solutions Residential Commercial Unincentivized Solar Energy TOTAL GreenChoice Residential Commercial GreenChoice TOTAL Community Solar Market Rate CAP Community Solar TOTAL Energy Efficiency Programs Customer Renewable Solutions (Solar/Community Solar/GreenChoice) Green Building Notes: AE Weatherization budget excludes rollover. All numbers are unaudited and will be adjusted in line with financial updates. This report has historically been filtered by paid date per enrollment. Beginning June 2022 the EES data is filtered on payment authorization (approval) date. 2/9/2026 Unaudited data updated monthly, as reported by CES teams. 3 Customer Energy Solutions FY26 YTD MW Savings Report As of December 2025 MW Saving Goal Tracking Solar Goal Tracking 40.00 35.00 30.00 25.00 20.00 15.00 13.47 11.87 14.82 10.00 5.00 0.00 36.731 7.00 6.00 5.00 4.00 3.00 2.00 1.00 0.00 2.34 1.64 0.99 0.51 0.31 0.20 5.833 5.000 Oct Nov Dec Jan Feb Mar Actual Apr Goal May Jun Jul Aug Sep Oct Nov Dec Jan Feb Mar Apr May Jun Jul Aug Sep Res Actual Com Actual Res Goal Com Goal 2/9/2026 Unaudited data updated monthly, as reported by CES teams. 3