Customer Energy Solutions FY 24 Savings Report — original pdf
Backup
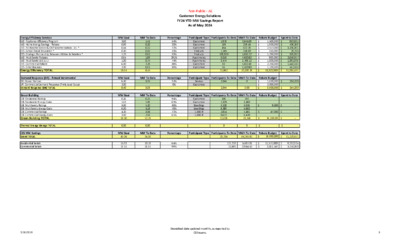
Energy Efficiency Services EES- Appliance Efficiency Program EES- Home Energy Savings - Rebate EES- AE Weatherization & CAP Weatherization - D.I. * EES- School Based Education * EES- Strategic Partnership Between Utilities & Retailers * EES- Multifamily Rebates EES- Multifamily WX-D.I.+ EES- Commercial Rebate EES- Small Business Energy Efficiency TOTAL Demand Response (DR) - Annual Incremental DR- Power Partner DR- Commercial Demand Response (frmly Load Coop) Demand Response (DR) TOTAL Green Building GB- Residential Ratings GB- Residential Energy Code GB- Multifamily Ratings GB- Multifamily Energy Code GB- Commercial Ratings GB- Commercial Energy Code Green Building TOTAL CES MW Savings Grand TOTAL Residential Totals Commercial Totals Non-Public - AE # Customer Energy Solutions FY24 YTD MW Savings Report As of May 2024 Participant Type Participants To Date MWh To Date MW Goal 2.60 0.90 0.44 0.30 1.75 0.65 1.00 6.00 2.00 15.64 MW Goal 6.40 2.00 8.40 MW Goal 0.26 1.63 3.00 6.00 4.20 3.90 19.00 MW To Date 1.41 0.20 0.32 0.07 0.92 1.89 0.74 2.28 0.61 8.44 MW To Date 3.33 3.33 MW To Date 0.25 1.06 1.20 4.18 3.04 2.53 12.25 Percentage 54% 23% 72% 23% 53% 291% 74% 38% 30% Percentage 52% 0% Percentage 94% 65% 40% 70% 72% 65% Customers Customers Customers Products Products Apartments Apartments Customers Customers Devices Customers Customers Customers Dwellings Dwellings 1,000 sf 1,000 sf Participant Type Participants To Date MWh To Date Participant Type Participants To Date MWh To Date Rebate Budget Spent to Date 2,645.03 279.55 602.28 358.00 2,653.17 4,630.82 1,788.12 5,822.49 1,420.80 20,200.26 0 0.00 290 1,460 3,043 5,882 5,401 8,470 24,546 Rebate Budget $ 1,500,000 $ 1,600,000 $ 2,577,000 $ 350,000 $ 1,250,000 $ 900,000 $ 1,800,000 $ 2,250,000 $ 1,100,000 $ 13,327,000 Spent to Date $ 860,661 $ 406,269 $ 3,206,001 $ 78,745 $ 576,032 $ 2,859,077 $ 1,091,909 $ 1,440,343 $ 497,394 $ 11,016,431 Rebate Budget $ 1,600,000 $ 2,000,000 $ 3,600,000 $ 254,230 $ 254,230 $ 9,300 $ - $ 47,000 $ - $ 56,300.00 $ - 1,976 198 454 1,595 109,530 6,016 3,474 83 66 13,862 2,344 2,344 306 1,325 3,108 8,289 2,814 8,677 13,028 0 MW Goal 43.04 MW To Date 24.02 Percentage Participant Type Participants To Date MWh To Date 29,234 44,745.81 Rebate Budget $ 16,983,300 Spent to Date $ 11,270,661 15.93 19.11 10.18 18.95 64% 99% 127,218 22,889 14707.01 22944.50 $ $ 11,577,000 2,063,543 $ $ 9,332,924 3,350,000 Thermal Energy Storage TOTAL 0.00 0.00 0 $ - $ - 7/10/2024 Unaudited data updated monthly, as reported by CES teams. 3 Non-Public - AE # Customer Energy Solutions FY24 YTD MW Savings Report As of May 2024 Percentage 40% 86% Participant Type Participants To Date MWh To Date Incentive Budget Spent to Date 953,500 13,388,188 $ 2,500,000 $ 2,750,000 Customers Customers $ $ 4,786 7,456 12,241 $ 5,250,000 $ 14,341,688 381 14 364 759 Customer Renewable Solutions Residential Commercial Unincentivized Solar Energy TOTAL GreenChoice Residential Commercial GreenChoice TOTAL Community Solar Market Rate CAP Community Solar TOTAL Energy Efficiency Programs Customer Renewable Solutions (Solar/Community Solar/GreenChoice) Green Building MW Goal 7.00 5.00 12.00 Participant Type Customers Customers Participant Type Customers Customers MW To Date 2.77 4.30 2.42 9.49 Participants 20,333 346 20,679 Participants 210 195 405 MWh 11,039.28 54,572.18 65,611.46 MWh 115.40 129.43 244.83 Outreach 3/06/2024 - La Loma Solar Tour - Martina Clifton Homeschool Group 3/22/2024 - La Loma Solar Tour - Texas Public Interest Research Group 3/23/2024 - Sunset Valley Public Works Open House 3/27/2024 - UT Architecture Classroom Presentation Notes: AE Weatherization budget excludes rollover. All numbers are unaudited and will be adjusted in line with financial updates. This report has historically been filtered by paid date per enrollment. Beginning June 2022 the EES data is filtered on payment authorization (approval) date. Through May, 72% Single Family homes and 6 multifamily developments (with a total of 1025 units) receiving AEGB ratings are in SMART Housing developments in the AE service area. 7/10/2024 Unaudited data updated monthly, as reported by CES teams. 3 Non-Public - AE # Customer Energy Solutions FY24 YTD MW Savings Report As of May 2024 MW Saving Goal Tracking Solar Goal Tracking 50.00 45.00 40.00 35.00 30.00 25.00 20.00 15.00 10.00 5.00 0.00 10.20 11.71 13.03 15.27 6.40 19.22 20.78 24.02 Apr Goal Actual 43.039 8.00 7.00 6.00 5.00 4.00 3.00 2.00 1.00 0.00 4.30 2.94 3.01 3.03 2.49 2.77 1.83 2.01 1.16 1.16 0.82 0.46 0.13 0.13 0.13 0.13 7.000 5.000 Oct Nov Dec Jan Feb Mar May Jun Jul Aug Sep Oct Nov Dec Jan Feb Mar Apr May Jun Jul Aug Sep Res Actual Com Actual Res Goal Com Goal 7/10/2024 Unaudited data updated monthly, as reported by CES teams. 3