Multifamily & Commercial Project Pipeline Monthly Report — original pdf
Backup
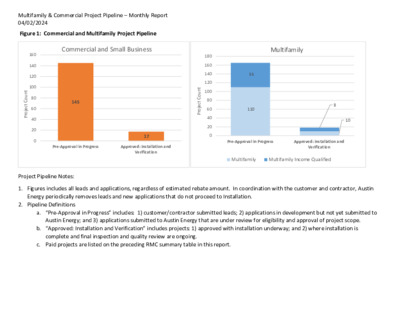
Multifamily & Commercial Project Pipeline – Monthly Report 04/02/2024 Figure 1: Commercial and Multifamily Project Pipeline Commercial and Small Business Multifamily t n u o C t c e o r P j 180 160 140 120 100 80 60 40 20 0 55 110 8 10 Pre-Approval in Progress Approved: Installation and Verification 17 Pre-Approval in Progress Approved: Installation and Verification Multifamily Multifamily Income Qualified 1. Figures includes all leads and applications, regardless of estimated rebate amount. In coordination with the customer and contractor, Austin Energy periodically removes leads and new applications that do not proceed to Installation. a. “Pre-Approval in Progress” includes: 1) customer/contractor submitted leads; 2) applications in development but not yet submitted to Austin Energy; and 3) applications submitted to Austin Energy that are under review for eligibility and approval of project scope. b. “Approved: Installation and Verification” includes projects: 1) approved with installation underway; and 2) where installation is complete and final inspection and quality review are ongoing. c. Paid projects are listed on the preceding RMC summary table in this report. 160 140 120 100 80 60 40 20 0 t n u o C t c e o r P j 145 Project Pipeline Notes: 2. Pipeline Definitions Multifamily & Commercial Project Pipeline – Monthly Report 04/02/2024 Table 1: Multifamily and Multifamily Income Qualified – Estimated RCA Project Pipeline (for estimated rebates >$72k) Program Latest Workflow Enrollment (s) # Location Name Installation Address Council District Estimated kW savings Estimated kWh savings Estimated $ Incentive Installation Lincoln Oaks 263.3 766,330 $257,806 11700 Metric Blvd 1266038, 1279735, 1292608, 1292617 Measures Planned Phase 1 (Complete): Water Saving Devices, Phase 2 (In Progress): LED Lighting, Plenum Remediation & Seal, HVAC Tune-Up, Smart Thermostats Total # of Units 296 Installation 1277574 Buckingham Place Duplexes 743 YARSA BLVD Installation 1301882 West Koenig Flats 5608 Avenue F 34.2 159,495 $74,700 HVAC Tune-Ups, Smart Thermostats 166 39.0 185,377 $109,200 HVAC Tune-up, Smart Thermostats 210 Installation 1299361 79.6 286,993 $151,432 HVAC Tune-Ups, Smart Thermostats, LED Lighting 292 Installation 1303113 53.5 256,991 $124,640 HVAC Tune-Ups, Smart Thermostats 304 Multifamily Income Qualified Multifamily Income Qualified Multifamily Income Qualified Multifamily Income Qualified Multifamily Income Qualified Multifamily Installation 1301185 Elan East 59.0 327,616 $121,687 HVAC Tune-Ups, Smart Thermostats, Water Saving Devices, ECAD Multifamily Installation 1300529 34.1 143,396 $100,399 HVAC Tune-Ups, Smart Thermostats, Attic Insulation Multifamily Installation 1294015 20.5 79,775 $77,004 HVAC Tune-Ups Multifamily Installation 1290116 142.3 440,533 $212,952 HVAC Tune-up, Smart Thermostats, Attic Insulation, Water Savings Devices Multifamily Installation 1291916 Creekstone Austin 81.0 277,217 $218,137 HVAC Tune-up, Smart Thermostats, Attic Insulation Multifamily Installation 1298340 Patten West 131.9 191,303 $175,260 LED Lighting, Duct Remediation & Seal, HVAC Tune-Ups, Attic Insulation 249 Reserve at Springdale Goodnight Commons 5605 Springdale Rd 2022 E Slaughter Ln 2900 Manor Rd The Establishment 3501 S 1st St 422 at the Lake 422 W Riverside Dr CHANDELIER APARTMENTS 2336 Douglas St 8054 Exchange Dr 2207 Wickersha m Ln 7 2 4 1 2 9 3 9 3 1 3 251 139 204 336 284 Multifamily & Commercial Project Pipeline – Monthly Report 04/02/2024 Program Latest Workflow Enrollment (s) # Location Name Installation Address Council District Estimated kW savings Estimated kWh savings Estimated $ Incentive Measures Planned Multifamily Installation 1301881 71.8 336,393 $205,412 HVAC Tune-Ups, Smart Thermostats 356 Multifamily Installation 1292651 108.2 450,426 $214,703 HVAC Tune-Ups Multifamily Paid 1294026 Multifamily Paid 1299131 Multifamily Paid 1300778 421.3 1,752 $272,740 Plenum Remediation & Seal, Attic Insulation 54.1 189,115 $126,889 HVAC Tune-Ups, Smart Thermostats, Attic Insulation 80.3 295,323 $173,521 HVAC Tune-Ups, Smart Thermostats, Attic Insulation Multifamily Paid 1294027 92.9 428,441 $218,664 HVAC Tune-Ups, Smart Thermostats 402 Villages at Turtle Rock The Park on Brodie Lane Ventana Oaks Luxury Apts 12800 Turtle Rock Rd 6607 Brodie Ln 9301 Spectrum Dr Madison Northridge 12001 Metric Blvd The Reserve at Walnut Creek 8038 Exchange Dr The Villages of Bella Vista 8515 BRODIE LN 6 5 6 7 1 5 Total # of Units 290 430 200 284 * projects in which the RCA Fact Sheet was submitted in a prior month’s report. Fact sheets summarize the projects and are provided when the project is completed. Multifamily & Commercial Project Pipeline – Monthly Report 04/02/2024 Table 2: Commercial and Small Business – Estimated RCA Project Pipeline (for estimated rebates >$72k) Program Latest Workflow Enrollment Number Location Name Installation Address kW savings kWh savings $ Incentive Measures Planned Council District * projects in which the RCA Fact Sheet was submitted in a prior month’s report. Fact sheets summarize the projects and are provided when the project is completed. Table 1 & 2 Notes: 1. Rebates, kW, and kWh are subject to change pending final installation scope and site inspections. 2. The above pipeline includes projects that, upon completion of the pre-installation inspection, exceed $66k in estimated rebates. RCA Fact Sheets will be provided for these projects when the project is completed. 3. Estimated kW and kWh savings include estimated transmission and distribution system losses. MULTIFAMILY REBATE FACT SHEET Ventana Oaks Note: Data reflects final installation and inspection; some values may have changed since original proposal scope. Ventana Oaks Ventana Oaks Luxury Apartment LLC 9301 SPECTRUM DR AUSTIN, TX 78717 1x1 = $1,292.63, 2x2 = $1,746.57, 3x2 = $2,109.20 Market Rate Property Name Customer Name Property Address Year Built Average Rent per Floor Plan[1] Number of Rentable Units Housing Type Water Heater Type Electric Utilization Intensity (EUI) Average Electric Utilization Intensity for cohort[2] 2001 430 Gas 6.72 7.79 Total Project Costs Total Rebate % of Total Construction Costs Rebate per Unit Performed Plenum Remediation & Seal on 430 Furred Down Air Handlers with Gas Heat. Installed Attic Insulation on 164689 square feet of roof. Project Annual Savings at 100% Occupancy Kilowatts (kW) Saved Kilowatt-hours (kWh) Saved $/kW– Estimated Annual Dollar Savings Per Unit[3] Measure Rebate Amount kW Saved kWh Saved $/kW Annual Dollar Savings Per Unit[4] Plenum Remediation & Seal Attic Insulation $144,480 $128,260 349.8 71.5 Measures Performed - Last 10 Years at this property 341,180 1,752 Completion Date $413 $1,793 $75 $0 Rebate Amount [1] Source: Property management [2] Cohort Type is determined by the year the property is built and the heating type (either gas or electric) [3] Calculation based on 10 cents per kWh. [4] Energy (kWh) and dollars ($) saved per project varies by both the size of the project and the type of heating. Projects with electric heat generally have higher savings than projects with gas heat. Project and Rebate $272,740 $272,740 100% $634 Note(s) 421 kW 342933 kWh $ 647/kW $75 Scope of Work