Multifamily & Commercial Project Pipeline Monthly Report — original pdf
Backup
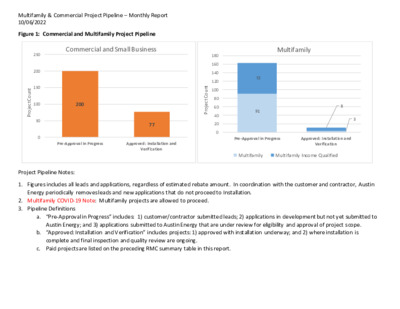
Multifamily & Commercial Project Pipeline – Monthly Report 10/06/2022 Figure 1: Commercial and Multifamily Project Pipeline Commercial and Small Business Multifamily 180 160 140 120 100 80 60 40 20 0 t n u o C t c e j o r P 72 91 250 200 150 100 50 0 t n u o C t c e j o r P 200 77 Pre-Approval in Progress Approved: Installation and Verification 8 3 Pre-Approval in Progress Approved: Installation and Verification Multifamily Multifamily Income Qualified Project Pipeline Notes: 1. Figures includes all leads and applications, regardless of estimated rebate amount. In coordination with the customer and contractor, Austin Energy periodically removes leads and new applications that do not proceed to Installation. 2. Multifamily COVID-19 Note: Multifamily projects are allowed to proceed. 3. Pipeline Definitions a. “Pre-Approval in Progress” includes: 1) customer/contractor submitted leads; 2) applications in development but not yet submitted to Austin Energy; and 3) applications submitted to Austin Energy that are under review for eligibility and approval of project s cope. b. “Approved: Installation and Verification” includes projects: 1) approved with installation underway; and 2) where installation is complete and final inspection and quality review are ongoing. c. Paid projects are listed on the preceding RMC summary table in this report. Multifamily & Commercial Project Pipeline – Monthly Report 10/06/2022 Table 1: Multifamily and Multifamily Income Qualified – Estimated RCA Project Pipeline (for estimated rebates >$66k) Program Latest Workflow Enrollment (s) # Location Name Installation Address Council District Estimated kW savings Estimated kWh savings Estimated $ Incentive Total # of Units Multifamily Income Qualified Multifamily Income Qualified Multifamily Income Qualified Multifamily Income Qualified Installation 1240491, 1263326 204.1 295,130 $245,248 Installation 1252104 24.7 140,916 $126,150 Installation 1252924 34.4 130,044 $71,274 Installation 1263649 55.2 187,790 $114,664 The Social Apartment s ROSEMON T AT OAK VALLEY Cherry Creek Duplexes SoCo/Circle S Apts 1817 E Oltorf St 2800 COLLINS CREEK DR 5510 Fernview Rd 7201 S Congress Ave Multifamily Income Qualified Paid 1231787, 1231196, 1231197 Trove Eastside* 2201 Montopolis Dr 3 222.8 592,964 $237,298 Multifamily Income Qualified Paid 1245134, 1263660 Chevy Chase Downs 2504 Huntwick Dr 3 331.2 726,667 $285,612 3 3 5 2 3 5 Multifamily Income Qualified Multifamily Income Qualified Paid 1254736, 1255009 Coppertree Apartment s 2425 Cromwell Cir Paid 1251538 Trails at the Park 815 W SLAUGHTER LN 495.0 1,074,533 $281,931 57.1 195,046 $93,516 LED lighting, HVAC Tune-Up, Smart Thermostats Measures Planned Phase 1 (Complete): Attic Insulation, Duct Remediation & Seal, Lighting Phase 2: HVAC Tune-Up, Smart Thermostat Attic Insulation, HVAC Tune-Up, Smart Thermostats, Lighting HVAC Tune-Up, Smart Thermostats, Lighting HVAC Tune-Up, Smart Thermostats, Lighting All phases: Plenum Remediation, Attic Insulation, Lighting, Smart Thermostats, HVAC Tune-Up, Advanced Power Strips. Phase 1: Bldgs 1-5 (Complete); Phase 2: Bldgs 6-10 (Complete); Phase 3 (Complete): Bldgs 11-15 Phase 1 (Complete): Attic Insulation, Lighting, Plenum Redesign & Remediation, ECAD incentive Phase 2 (Complete): HVAC Tune- up, Smart Thermostats Phase 1 (Complete): Plenum Redesign & Remediation, Attic Insulation, Phase 2: (Complete) Lighting Smart Thermostat, HVAC Tune- Up, Water Savings Devices 223 280 122 200 280 240 252 200 Multifamily & Commercial Project Pipeline – Monthly Report 10/06/2022 Program Latest Workflow Enrollment (s) # Location Name Installation Address Council District Estimated kW savings Estimated kWh savings Estimated $ Incentive Multifamily Income Qualified Paid 1257093 72.1 185,701 $73,023 Multifamily Installation 1262337 153.7 319,794 $192,656 Multifamily Installation 1265247 95.6 338,549 $199,762 Chase Georgian* 8005 GEORGIAN DR Cortland Southpark Terraces Sundance Apartment s Pearl Lantana Apartment s 10101 S 1st St 1006 Banister Ln 6401 RIALTO BLVD 4 5 3 8 Measures Planned Plenum Redesign & Remediation, Duct remediation, , Attic Insulation, Lighting, Smart Thermostat, HVAC Tune-Up, Water Savings Devices, ECAD incentive Attic Insulation, Duct Remediation & Seal, HVAC Tune-Up, Smart Thermostats, ECAD Incentive Attic Insulation, HVAC Tune-Up, Smart Thermostats, Lighting, Water Savings Devices Total # of Units 68 244 228 444 Multifamily Paid 1254525 135.8 459,443 $233,409 HVAC Tune-Ups, Smart Thermostats, LED Lighting * projects in which the RCA Fact Sheet was submitted in a prior month’s report. Fact sheets summarize the projects and are provided when the project is completed. Multifamily & Commercial Project Pipeline – Monthly Report 10/06/2022 Table 2: Commercial and Small Business – Estimated RCA Project Pipeline (for estimated rebates >$66k) Program Latest Workflow Enrollment Number Council District Location Name Installation Address kW savings kWh savings $ Incentive Measures Planned Commercial Installation 1249815 ROUND ROCK ISD – Westwood HS 12400 MELLOW MEADOW DR 174.9 650,746 $82,434 Commercial Paid 1248944 Commercial Paid 1248944 Commercial Paid 1248165 CAPITOL CENTER 919 CONGRESS AVE 76.5 186,581 $72,600 STATE TFC 1700 CONG AVE 179.2 155,176 $99,901 STATE TFC 1601 CONG AVE 721,981 $77,609 Commercial Paid 1265536 STATE TFC 1801 CONG AVE 1,604,583 $173,461 Lighting Commercial Paid* 1271020 129.4 264,660 $177,605 Chillers, Cooling Towers TRAVIS COUNTY CORRECTIONAL COMPLEX 3614 BILL PRICE RD 100 6 9 9 9 9 2 230.9 515.3 Commercial Paid* 1245215 AISD 2710 EXPOSITION BLVD 10 196.1 2,352,835 $80,135 Cooling Towers, Chillers, Variable Frequency Drives (VFD) Chillers, Variable Frequency Drives (VFD) Chillers, Variable Frequency Drives (VFD) Lighting, Regen Elevators Cooling Towers, Lighting, Variable Frequency Drives (VFD), HVAC * projects in which the RCA Fact Sheet was submitted in a prior month’s report. Fact sheets summarize the projects and are provided when the project is completed. Table 1 & 2 Notes: 1. Rebates, kW, and kWh are subject to change pending final installation scope and site inspections. 2. The above pipeline includes projects that, upon completion of the pre-installation inspection, exceed $66k in estimated rebates. RCA Fact Sheets will be provided for these projects when the project is completed. 3. Estimated kW and kWh savings include estimated transmission and distribution system losses. MULTIFAMILY REBATE FACT SHEET Chevy Chase Downs Note: Data reflects final installation and inspection; some values may have changed since original proposal scope. Property Name Customer Name Property Address Year Built Average Rent per Floor Plan[1] Number of Rentable Units Housing Type Water Heater Type Electric Utilization Intensity (EUI) Average Electric Utilization Intensity for cohort[2] Chevy Chase Downs Apartments Texas Chevy Chase Downs LTD 2504 HUNTWICK DR Austin, TX 78741 1985 1x1 = $859.33, 2x1.5 = $1,012.03, 2x2 = $1,144.92 240 Income Qualified. 124 CAP customers out of 240 units. 51.67% CAP customers Electric 10.38 10.67 Total Project Costs Total Rebate % of Total Construction Costs Rebate per Unit Kilowatts (kW) Saved Kilowatt-hours (kWh) Saved $/kW– Estimated Annual Dollar Savings Per Unit[3] Project and Rebate $296,593 $288,112 97% $1,200 Note(s) 331 kW 726667 kWh $ 835/kW $285 Scope of Work Performed Duct Remediation and Sealing on 240 Furred Down Air Handlers with Electric Heat. Installed Attic Insulation on 8140 0 square feet of roof. Replace 2477 existing Incandescent, Candelabra, Spot or Linear Fluorescent lamps with a like number of LED lamps. Installed 231Nest Thermostat E smart thermostats. Performed HVAC Tune-Up on 242 units with the total tonnage of 396 tons. Performed energy audit. Project Annual Savings at 100% Occupancy Measure Rebate Amount kW Saved kWh Saved $/kW Annual Dollar Savings Per Unit[4] Duct Remediation & Seal Attic Insulation Lighting Smart Thermostats HVAC Tune-Up ECAD Incentive Income Qualified Limited Time Bonus $84,000 $64,306 $10,956 $34,650 $82,600 $2,500 $9,100 240.3 35.4 11.8 20.1 23.5 - - 484,720 27,715 7,524 115,273 91,436 - - Completion Date $350 $1,819 $926 $1,722 $3,514 - - $190 $11 $3 $45 $36 - - Measures Performed - Last 10 Years at this property Rebate Amount [1] Source: Property management [2] Cohort Type is determined by the year the property is built and the heating type (either gas or electric) [3] Calculation based on 10 cents per kWh. [4] Energy (kWh) and dollars ($) saved per project varies by both the size of the project and the type of heating. Projects with electric heat generally have higher savings than projects with gas heat. MULTIFAMILY REBATE FACT SHEET Coppertree Apartments Property Name Customer Name Property Address Year Built Average Rent per Floor Plan[1] Number of Rentable Units Housing Type Water Heater Type Electric Utilization Intensity (EUI) Average Electric Utilization Intensity for cohort[2] Note: Data reflects final installation and inspection; some values may have changed since original proposal scope. Coppertree Apartments DTI Properties 2425 CROMWELL CIR Austin, TX 78741 1971 1x1 = $881.53, 2x2 = $1,085.30 252 Income Qualified. 95 CAP customers out of 252 units. 37% CAP. Electric 0 Meter Data Not Found Total Project Costs Total Rebate % of Total Construction Costs Rebate per Unit Kilowatts (kW) Saved Kilowatt-hours (kWh) Saved $/kW– Estimated Annual Dollar Savings Per Unit[3] Project and Rebate $281,932 $281,932 100% $1,119 Note(s) 495 kW 1074533 kWh $ 570/kW $401 Scope of Work Performed Duct Remediation and Sealing on 252 Furred Down Air Handlers with Electric Heat. Installed Attic Insulation on 6068 6 square feet of roof. Replace 1843 existing Incandescent, Candelabera, Spot or Linear Fluorescent lamps with a like number of LED lamps. Installed 231Honeywell Lyric T-Series smart thermostats. Performed HVAC Tune-Up on 252 units with the total tonnage of 445 tons. Performed energy audit. Project Annual Savings at 100% Occupancy Measure Rebate Amount kW Saved kWh Saved $/kW Annual Dollar Savings Per Unit[4] Duct Remediation & Seal Attic Insulation Lighting Smart Thermostats HVAC Tune-Up Water Saving Devices ECAD Incentive Income Qualified Limited Time Bonus $78,400 $60,079 $7,875 $34,650 $83,120 $2,407 $2,500 $12,900 386.0 49.0 8.6 20.1 26.4 4.9 - - 778,393 20,662 5,492 115,273 102,750 51,963 - - $203 $1,226 $912 $1,722 $3,147 $496 - - $290 $8 $2 $43 $38 $19 - - Measures Performed - Last 10 Years at this property [1] Source: Property management [2] Cohort Type is determined by the year the property is built and the heating type (either gas or electric) [3] Calculation based on 10 cents per kWh. [4] Energy (kWh) and dollars ($) saved per project varies by both the size of the project and the type of heating. Projects with electric heat generally have higher savings than projects with gas heat. Completion Date Rebate Amount MULTIFAMILY REBATE FACT SHEET Pearl Lantana Note: Data reflects final installation and inspection; some values may have changed since original proposal scope. Property Name Customer Name Property Address Year Built Average Rent per Floor Plan[1] Number of Rentable Units Housing Type Water Heater Type Electric Utilization Intensity (EUI) Average Electric Utilization Intensity for cohort[2] PEARL LANTANA APARTMENTS MGI-GFP LANTANA HOLDINGS LLC 6401 RIALTO BLVD Sunset Valley, TX 78735 2016 444 Market Rate Gas 5.64 7.48 Project and Rebate Total Project Costs Total Rebate % of Total Construction Costs Rebate per Unit Kilowatts (kW) Saved Kilowatt-hours (kWh) Saved $/kW– Estimated Annual Dollar Savings Per Unit[3] $233,409 $233,409 100% $526 Note(s) 136 kW 459443 kWh $ 1719/kW $97 Scope of Work Replaced 8621 existing Incandescent, Candelabra, Spot or Linear Fluorescent lamps with a like number of LED lamps. Installed 435Honeywell Lyric T-Series smart thermostats. Performed HVAC Tune-Up on 448 units with the total tonnage of 932.5 tons. Project Annual Savings at 100% Occupancy Measure Rebate Amount kW Saved kWh Saved $/kW Annual Dollar Savings Per Unit[4] $608 $2,066 $2,335 $6 $46 $46 Lighting Smart Thermostats HVAC Tune-Up $25,863 $78,300 $129,246 42.6 37.9 55.4 27,058 217,072 215,313 Completion Date Measures Performed - Last 10 Years at this property Rebate Amount [1] Source: CoStar [2] Cohort Type is determined by the year the property is built and the heating type (either gas or electric) [3] Calculation based on 10 cents per kWh. [4] Energy (kWh) and dollars ($) saved per project varies by both the size of the project and the type of heating. Projects with electric heat generally have higher savings than projects with gas heat. MULTIFAMILY REBATE FACT SHEET Trails at the Park Note: Data reflects final installation and inspection; some values may have changed since original proposal scope. Property Name Customer Name Property Address Year Built Average Rent per Floor Plan[1] Number of Rentable Units Housing Type Water Heater Type Electric Utilization Intensity (EUI) Average Electric Utilization Intensity for cohort[2] Total Project Costs Total Rebate % of Total Construction Costs Rebate per Unit Trails at the Park Foundation Communities 815 SLAUGHTER LN Austin, TX 78748 1999 200 Income Qualified; Foundation Communities property. Non-Profit. 85 CAP customers found as of 03/17/20. (42.5% CAP) Electric 8.35 8.15 Replace 3428 existing Incandescent, Candelabera, Spot or Linear Fluorescent lamps with a like number of LED lamps. Installed 170Nest Thermostat E smart thermostats. Performed HVAC Tune-Up on 200 units with the total tonnage of 431.5 tons. Project Annual Savings at 100% Occupancy Kilowatts (kW) Saved Kilowatt-hours (kWh) Saved $/kW– Estimated Annual Dollar Savings Per Unit[3] Measure Lighting Smart Thermostats HVAC Tune-Up Income Qualified Limited Time Bonus Rebate Amount kW Saved kWh Saved $/kW Annual Dollar Savings Per Unit[4] $11,886 $25,500 $55,130 $1,000 16.6 14.8 25.6 - 10,581 84,833 99,633 - Completion Date $714 $1,722 $2,152 - $5 $40 $47 - Measures Performed - Last 10 Years at this property Rebate Amount Duct Remediation & Sealing Energy Audit [1] Source: CoStar [2] Cohort Type is determined by the year the property is built and the heating type (either gas or electric) [3] Calculation based on 10 cents per kWh. [4] Energy (kWh) and dollars ($) saved per project varies by both the size of the project and the type of heating. Projects with electric heat generally have higher savings than projects with gas heat. 1/20/2016 4/19/2016 $61,345 Project and Rebate $93,516 $93,516 100% $468 Note(s) 57 kW 195046 kWh $ 1,639/kW $92 Scope of Work MULTIFAMILY REBATE FACT SHEET Trove Eastside Note: Data reflects final installation and inspection; some values may have changed since original proposal scope. Trove Eastside LAVORO TOWNE VISTA LLC 2201 MONTOPOLIS DR AUSTIN, TX 78741 2003 1x1 = $838, 2x2 = $1,025, 3x2 = $1,185 280 Income Qualified. Income Level A, B (Tenant Based) Income Restricted (Max $35,000/year) Section 8 Voucher 280 Total Units 280 Low-Income Units Low Income Housing Tax Credit Program, TCHFC Bond Program Gas 8.89 7.48 Property Name Customer Name Property Address Year Built Average Rent per Floor Plan[1] Number of Rentable Units Housing Type Water Heater Type Electric Utilization Intensity (EUI) Average Electric Utilization Intensity for cohort[2] Total Project Costs Total Rebate % of Total Construction Costs Rebate per Unit Kilowatts (kW) Saved Kilowatt-hours (kWh) Saved $/kW– Estimated Annual Dollar Savings Per Unit[3] Duct Remediation & Seal Attic Insulation Lighting Smart Thermostats HVAC Tune-Up Income Qualified Limited Time Bonus APS Distribution $98,000 $11,534 $12,594 $40,500 $73,110 $160 $1,400 Project and Rebate $239,639 $237,298 99% $847 Note(s) 223 kW 592964 kWh $1,065/kW $199 Scope of Work Performed Duct Remediation and Sealing on 280 Furred Down Air Handlers with Electric Heat. Installed Attic Insulation on 1460 0 square feet of roof. Replace 4198 existing Incandescent, Candelabra, Spot or Linear Fluorescent lamps with a like number of LED lamps. Installed 270Ecobee3 lite smart thermostats. Performed HVAC Tune-Up on 280 units with the total tonnage of 424 tons. Distributed 280 Advanced Power Strips. Project Annual Savings at 100% Occupancy Measure Rebate Amount kW Saved kWh Saved Annual Dollar Savings Per Unit[4] 143.3 6.3 20.7 23.5 25.2 - 3.8 289,003 4,971 13,176 134,734 97,901 - 53178.7 Completion Date $/kW $684 $1,819 $608 $1,722 $2,905 - 372.3 $97 $2 $4 $45 $33 - 17.9 Measures Performed - Last 10 Years at this property [1] Source: Property management [2] Cohort Type is determined by the year the property is built and the heating type (either gas or electric) [3] Calculation based on 10 cents per kWh. [4] Energy (kWh) and dollars ($) saved per project varies by both the size of the project and the type of heating. Projects with electric heat generally have higher savings than projects with gas heat. Rebate Amount COMMERCIAL REBATE FACT SHEET STATE TFC/TFC CAPITOL COMPLEX Note: Data reflects final installation and inspection; some values may have changed since original proposal scope. Property Name Customer Name Property Address Total Square Feet Year Built Water Heater Type Total Project Costs Total Rebate Texas Facilities Commission (TFC) Capitol Complex State of Texas 1601 Congress Avenue, Austin TX 78701 401,475 2022 Central Plant Estimated $581M total for Phase 1 $77,609 <1% % of Total Construction Costs Note(s) Phase 1 of the Texas Capital Complex Master Plan has been completed. Two new office buildings totaling over a million sq ft will centralize office space for several state agencies. The two office buildings (1601 and 1801 Congress) are supported by a sep arate Central Utility Plant (1700 Congress) that provides cooling and heating. 230.9 721,980 $336 Project Annual Savings Kilowatt (kW) Kilowatt-hours (kWh) $/kW Scope of Work Measure New Construction Lighting Hydraulic Elevators Limited Time 30% Bonus Rebate Measures Performed in last 10 years at this property n/a Rebate $55,272.08 $4,427.50 $17,909.87 kW Saved 149.4 12.7 kWh Saved 559,293 47,824 Completion Date Rebate Amount $/kW $370/kW $350/kW COMMERCIAL REBATE FACT SHEET STATE TFC/Capitol Complex Central Utility Plant Note: Data reflects final installation and inspection; some values may have changed since original proposal scope. Property Name Customer Name Property Address Total Square Feet Year Built Water Heater Type Total Project Costs Total Rebate Capitol Complex Central Utility Plant State of Texas 1700 Congress Avenue, Austin TX 78701 603,000 2022 Central Plant Estimated $581M total for Phase 1 $99,901 <1% % of Total Construction Costs Note(s) Phase 1 of the Texas Capital Complex Master Plan has been completed. Two new office buildings totaling over a million sq ft will centralize office space for several state agencies. The two office buildings (1601 and 1801 Congress) are supported by a sep arate Central Utility Plant (1700 Congress) that provides cooling and heating. Project Annual Savings Kilowatt (kW) Kilowatt-hours (kWh) $/kW Scope of Work 179 155,175 $557 Measure Chillers Cooling Tower New Construction Lighting VFD Secondary Chiller Water Pumps VFD Cooling Tower Fan VFD Cooling Tower Fan VFD Primary Chiller Water Pumps Limited Time Bonus Rebate Measures Performed in last 10 years at this property N/A Rebate $29,980 $21,168 $159 $10,640 $4,256 $6,652 $3,992 $23,054 kWh Saved 21,310 128,419 5,285 66 26 41 25 kW Saved 73.243 70.56 1.517 26.6 10.64 16.63 9.98 $/kW $409 $300 $104 $400 $400 $400 $400 Completion Date Rebate Amount COMMERCIAL REBATE FACT SHEET STATE TFC/ G H. W. Bush State Office Building Note: Data reflects final installation and inspection; some values may have changed since original proposal scope. Property Name Customer Name Property Address Total Square Feet Year Built Water Heater Type Total Project Costs Total Rebate George H. W. Bush State Office Building State of Texas 1801 Congress Avenue, Austin TX 78701 603,000 2022 Central Plant Estimated $581M total for Phase 1 $173,461.35 <1% % of Total Construction Costs Note(s) Phase 1 of the Texas Capital Complex Master Plan has been completed. Two new office buildings totaling over a million sq ft will centralize office space for several state agencies. The two office buildings (1601 and 1801 Congress) are supported by a sep arate Central Utility Plant (1700 Congress) that provides cooling and heating. 515.2 1,604,583 $336 Project Annual Savings Kilowatt (kW) Kilowatt-hours (kWh) $/kW Scope of Work Hydraulic Elevators Measure New Construction Lighting Limited Time Bonus Rebate Measures Performed in last 10 years at this property n/a Rebate $11,334 $124,713 $37,413 kW Saved 24.91 337.063 kWh Saved 88,456 126,1963.872 Completion Date Rebate Amount $/kW $350 $370 COMMERCIAL REBATE FACT SHEET Capital Center Note: Data reflects the proposal scope prior to installation and is subject to change pending final installation and inspection. Property Name Customer Name Property Address Capital Center Capital Center 919 Congress Ave., Austin, TX 78701 544,064 sqft 1983 $456,165 $76,830 16% Total Square Feet Year Built Total Project Costs - Estimated Total Rebate – Estimated % of Total Construction Costs Note(s) A major HVAC retrofit for chillers at this 15 story, class A commercial office property. Project Annual Savings (Estimated) Kilowatt (kW) - Estimated Kilowatt-hours (kWh) - Estimated $/kW 76.5 186,581 $948/kW Scope of Work Measure Chiller Retrofit VFD Limited Time Bonus Rebate Rebate - Estimated $45,000 $14,100 $17,730 kW Saved – Estimated 33.9 42.7 kWh Saved – Estimated 186,487 94 $/kW $1,328.22 $330.60