Customer Energy Solutions FY22 Savings Report — original pdf
Backup
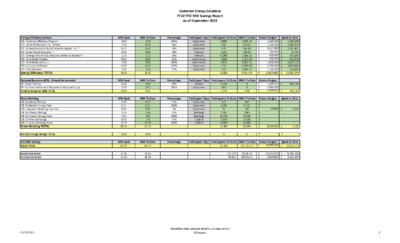
Energy Efficiency Services EES- Appliance Efficiency Program EES- Home Performance ES - Rebate EES- AE Weatherization & CAP Weatherization - D.I. * EES- School Based Education * EES- Strategic Partnership Between Utilities & Retailers * EES- Multifamily Rebates EES- Multifamily WX-D.I.+ EES- Commercial Rebate EES- Small Business Energy Efficiency TOTAL Demand Response (DR) - Annual Incremental DR- Power Partner DR- Commercial Demand Response (frmly Load Coop) Demand Response (DR) TOTAL Green Building GB- Residential Ratings GB- Residential Energy Code GB- Integrated Modeling Incentive GB- Multifamily Ratings GB- Multifamily Energy Code GB- Commercial Ratings GB- Commercial Energy Code Green Building TOTAL CES MW Savings Grand TOTAL Residential Totals Commercial Totals Customer Energy Solutions FY22 YTD MW Savings Report As of September 2022 Participant Type Participants To Date MWh To Date MW Goal 2.60 1.30 0.53 0.10 1.75 0.65 1.00 6.00 2.00 15.93 MW Goal 6.40 2.00 8.40 MW Goal 0.50 6.21 0.56 1.55 7.04 8.00 14.72 38.57 MW To Date 2.70 0.60 0.42 0.03 1.12 0.53 3.05 8.22 1.94 18.61 MW To Date 3.85 5.61 9.46 MW To Date 0.31 6.21 0.04 1.04 7.04 7.76 14.72 37.12 Percentage 104% 46% 79% 28% 64% 81% 305% 137% 97% Percentage 60% 281% Percentage 62% 100% 7% 67% 100% 97% 100% Customers Customers Customers Products Products Apartments Apartments Customers Customers Devices Customers Customers Customers Customers Dwellings Dwellings 1,000 sf 1,000 sf Participant Type Participants To Date MWh To Date Participant Type Participants To Date MWh To Date Spent to Date 5,039.74 833.61 526.90 196.92 5,404.23 1,197.70 6,907.31 22,071.36 4,489.57 46,667.34 0 0 0.00 499 8,121 100 2,863 19,049 14,396 40,066 85,095 Rebate Budget $ 1,500,000 $ 1,300,000 $ 2,577,000 $ 200,000 $ 900,000 $ 900,000 $ 1,800,000 $ 2,250,000 $ 1,100,000 $ 12,527,000 Spent to Date $ 1,250,500 $ 1,048,972 $ 2,382,487 $ 70,793 $ 519,646 $ 657,870 $ 3,072,712 $ 2,560,604 $ 955,686 $ 12,519,270 Rebate Budget $ 1,499,910 $ 2,000,000 $ 3,499,910 $ 306,120 $ 306,120 Rebate Budget $ - $ - $ 10,000 $ - $ - $ - $ - $ 10,000.00 $ 5,723 $ 5,723 3,889 456 479 1,525 95,985 1,358 5,952 116 107 13,882 2,716 560 3,276 417 4,796 79 2,787 11,323 6,334 14,867 19,402 0 MW Goal 62.90 MW To Date 65.19 Percentage Participant Type Participants To Date MWh To Date 36,560 131,762.17 Rebate Budget $ 16,036,910 Spent to Date $ 12,831,112 21.04 41.31 18.82 46.33 117,573 36,094 28726.79 102935.41 $ $ 10,676,910 5,350,000 $ $ 9,309,100 3,516,290 Thermal Energy Storage TOTAL 0.00 0.00 0 $ - $ - 11/10/2022 Unaudited data updated monthly, as reported by CES teams. 3 Customer Energy Solutions FY22 YTD MW Savings Report As of September 2022 Percentage 83% 27% Participant Type Participants To Date MWh To Date Incentive Budget Spent to Date 2,520,000 2,280,379 $ 2,500,000 $ 2,750,000 Customers Customers $ $ 9,928 2,316 12,244.00 $ 5,250,000 $ 4,800,379 786 19 471 1276 Participant Type Participants To Date MW Goal 7.00 5.00 12.00 Customers Customers Customers Customers MW To Date 5.78 1.34 3.58 10.69 27,909 461 28,370 276 165 441 Participant Type Participants To Date MWh To Date 217,614.02 577,732.30 795,346.32 MWh To Date 2,420.00 1,538.00 3,958.00 Customer Renewable Solutions Residential Commercial Unincentivized Solar Energy TOTAL GreenChoice Residential Commercial GreenChoice TOTAL Community Solar Market Rate CAP Community Solar TOTAL Energy Efficiency Programs Solar Green Building Notes: AE Weatherization budget excludes rollover. All numbers are unaudited and will be adjusted in line with financial updates. This report has historically been filtered by paid date per enrollment. Beginning June 2022 the EES data is filtered on payment authorization (approval) date. Through September, 45% Single Family homes and 15 Multifamily developments (with a total of 1857 units) receiving AEGB ratings are in SMART Housing developments in the AE service area. 11/10/2022 Unaudited data updated monthly, as reported by CES teams. 3 Customer Energy Solutions FY22 YTD MW Savings Report As of September 2022 MW Saving Goal Tracking Solar Goal Tracking 65.19 62.902 52.91 47.18 43.71 70.00 60.00 50.00 40.00 30.00 20.00 10.00 0.00 15.85 11.49 8.29 3.22 39.83 35.08 29.35 23.99 Apr Goal Actual 8.00 7.00 6.00 5.00 4.00 3.00 2.00 1.00 0.00 5.78 5.78 5.03 7.000 5.000 3.84 4.04 2.38 2.53 2.12 2.97 1.55 1.10 0.30 0.00 0.06 0.12 0.33 0.33 0.70 0.78 0.88 0.88 0.88 1.34 1.34 Res Actual Com Actual Res Goal Com Goal Oct Nov Dec Jan Feb Mar May Jun Jul Aug Sep Oct Nov Dec Jan Feb Mar Apr May Jun Jul Aug Sep 11/10/2022 Unaudited data updated monthly, as reported by CES teams. 3