Customer Energy Solutions FY22 Savings Report — original pdf
Backup
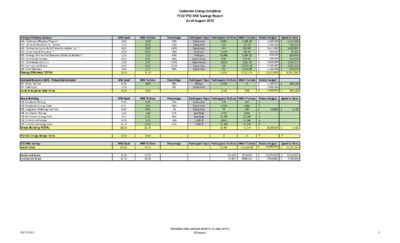
Energy Efficiency Services EES- Appliance Efficiency Program EES- Home Performance ES - Rebate EES- AE Weatherization & CAP Weatherization - D.I. * EES- School Based Education * EES- Strategic Partnership Between Utilities & Retailers * EES- Multifamily Rebates EES- Multifamily WX-D.I.+ EES- Commercial Rebate EES- Small Business Energy Efficiency TOTAL Demand Response (DR) - Annual Incremental DR- Power Partner DR- Load Coop Demand Response (DR) TOTAL Green Building GB- Residential Ratings GB- Residential Energy Code GB- Integrated Modeling Incentive GB- Multifamily Ratings GB- Multifamily Energy Code GB- Commercial Ratings GB- Commercial Energy Code Green Building TOTAL CES MW Savings Grand TOTAL Residential Totals Commercial Totals Customer Energy Solutions FY22 YTD MW Savings Report As of August 2022 Participant Type Participants To Date MWh To Date MW Goal 2.60 1.30 0.53 0.10 1.75 0.65 1.00 6.00 2.00 15.93 MW Goal 6.40 2.00 8.40 MW Goal 0.50 6.21 0.56 1.55 7.04 8.00 14.72 38.57 MW To Date 2.40 0.54 0.60 0.03 1.12 0.36 2.79 6.69 1.77 16.30 MW To Date 3.85 3.85 MW To Date 0.28 5.86 0.04 1.03 6.73 5.96 12.85 32.76 Percentage 92% 42% 113% 28% 64% 56% 279% 111% 89% Percentage 60% 0% Percentage 57% 94% 7% 67% 96% 74% 87% Customers Customers Customers Products Products Apartments Apartments Customers Customers Devices Customers Customers Customers Customers Dwellings Dwellings 1,000 sf 1,000 sf Participant Type Participants To Date MWh To Date Participant Type Participants To Date MWh To Date Spent to Date 4,503.53 757.32 982.06 196.92 5,404.23 652.46 5,941.39 17,916.45 4,012.80 40,367.16 0 0.00 453 7,664 100 2,844 18,348 12,586 35,278 77,274 Rebate Budget $ 1,500,000 $ 1,300,000 $ 2,577,000 $ 200,000 $ 900,000 $ 900,000 $ 1,800,000 $ 2,250,000 $ 1,100,000 $ 12,527,000 Spent to Date $ 1,114,325 $ 958,332 $ 2,430,364 $ 70,793 $ 519,646 $ 364,074 $ 2,594,217 $ 2,035,532 $ 873,073 $ 10,960,356 Rebate Budget $ 1,499,910 $ 2,000,000 $ 3,499,910 $ 306,120 $ 306,120 Rebate Budget $ - $ - $ 10,000 $ - $ - $ - $ - $ 10,000.00 $ 5,723 $ 5,723 3,481 414 494 1,525 95,985 850 5,053 101 95 12,013 2,716 2,716 376 4,526 79 2,747 10,739 4,955 13,260 18,467 0 MW Goal 62.90 MW To Date 52.91 Percentage Participant Type Participants To Date MWh To Date 33,196 117,640.68 Rebate Budget $ 16,036,910 Spent to Date $ 11,272,199 21.04 41.31 17.83 35.04 115,420 31,897 26554.88 90985.81 $ $ 10,676,910 5,350,000 $ $ 8,357,871 2,908,605 Thermal Energy Storage TOTAL 0.00 0.00 0 $ - $ - 10/11/2022 Unaudited data updated monthly, as reported by CES teams. 3 Customer Energy Solutions FY22 YTD MW Savings Report As of August 2022 Percentage 83% 27% Participant Type Participants To Date MWh To Date Incentive Budget Spent to Date 2,520,000 2,280,379 $ 2,500,000 $ 2,750,000 Customers Customers $ $ 9,928 2,316 12,244.00 $ 5,250,000 $ 4,800,379 786 19 471 1276 Participant Type Participants To Date MW Goal 7.00 5.00 12.00 Customers Customers Customers Customers MW To Date 5.78 1.34 3.58 10.69 27,181 452 27,633 276 165 441 Participant Type Participants To Date MWh To Date 193,447.18 523,344.08 716,791.26 MWh To Date 2,420.00 1,538.00 3,958.00 Customer Renewable Solutions Residential Commercial Unincentivized Solar Energy TOTAL GreenChoice Residential Commercial GreenChoice TOTAL Community Solar Market Rate CAP Community Solar TOTAL Energy Efficiency Programs Solar Green Building Notes: AE Weatherization budget excludes rollover. All numbers are unaudited and will be adjusted in line with financial updates. This report has historically been filtered by paid date per enrollment.Beginning this month (June 2022) the EES data is filtered on payment authorization (approval) date Through August, 48% Single Family homes and 13 Multifamily developments (with a total of 1814 units) receiving AEGB ratings are in SMART Housing developments in the AE service area. 10/11/2022 Unaudited data updated monthly, as reported by CES teams. 3 Customer Energy Solutions FY22 YTD MW Savings Report As of August 2022 MW Saving Goal Tracking Solar Goal Tracking 70.00 60.00 50.00 40.00 30.00 20.00 10.00 0.00 15.85 11.49 8.29 3.22 62.902 52.91 47.18 43.71 39.83 35.08 29.35 23.99 8.00 7.00 6.00 5.00 4.00 3.00 2.00 1.00 0.00 5.78 5.03 7.000 5.000 3.84 4.04 2.38 2.53 2.12 2.97 1.55 1.10 0.30 0.00 0.06 0.12 0.33 0.33 0.70 0.78 0.88 0.88 0.88 1.34 Res Actual Com Actual Res Goal Com Goal Oct Nov Dec Jan Feb Mar May Jun Jul Aug Sep Oct Nov Dec Jan Feb Mar Apr May Jun Jul Aug Sep Apr Goal Actual 10/11/2022 Unaudited data updated monthly, as reported by CES teams. 3