Multifamily & Commercial Project Pipeline Monthly Report — original pdf
Backup
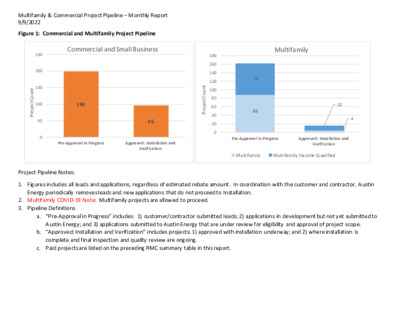
Multifamily & Commercial Project Pipeline – Monthly Report 9/9/2022 Figure 1: Commercial and Multifamily Project Pipeline Commercial and Small Business Multifamily 250 200 150 100 50 0 t n u o C t c e j o r P 180 160 140 120 100 80 60 40 20 0 t n u o C t c e j o r P 74 88 198 96 12 4 Pre-Approval in Progress Approved: Installation and Verification Pre-Approval in Progress Approved: Installation and Verification Multifamily Multifamily Income Qualified Project Pipeline Notes: 1. Figures includes all leads and applications, regardless of estimated rebate amount. In coordination with the customer and contractor, Austin Energy periodically removes leads and new applications that do not proceed to Installation. 2. Multifamily COVID-19 Note: Multifamily projects are allowed to proceed. 3. Pipeline Definitions a. “Pre-Approval in Progress” includes: 1) customer/contractor submitted leads; 2) applications in development but not yet submitted to Austin Energy; and 3) applications submitted to Austin Energy that are under review for eligibility and approval of project scope. b. “Approved: Installation and Verification” includes projects: 1) approved with installation underway; and 2) where installation is complete and final inspection and quality review are ongoing. c. Paid projects are listed on the preceding RMC summary table in this report. Multifamily & Commercial Project Pipeline – Monthly Report 9/9/2022 Table 1: Multifamily and Multifamily Income Qualified – Estimated RCA Project Pipeline (for estimated rebates >$66k) Program Latest Workflow Enrollmen t (s) # Location Name Installation Address Council District Estimated kW savings Estimated kWh savings Estimated $ Incentive Multifamily Income Qualified Installation 1231787, 1231196, 1231197 Trove Eastside* 2201 Montopolis Dr 3 216.0 593,241 $281,549 Multifamily Income Qualified Multifamily Income Qualified Multifamily Income Qualified Multifamily Income Qualified Multifamily Income Qualified Multifamily Income Qualified Multifamily Income Qualified Installation 1245134, 1263660 Chevy Chase Downs 2504 Huntwick Dr 3 332.3 732,428 $273,762 Installation 1240491, 1263326 The Social Apartments 1817 E Oltorf St 3 204.1 295,130 $245,248 Installation 1254736, 1255009 Coppertree Apartments 2425 Cromwell Cir 329.5 853,125 $240,742 Installation 1251538 Installation 1252104 Installation 1252924 3 5 3 5 4 Trails at the Park ROSEMONT AT OAK VALLEY Cherry Creek Duplexes 815 W SLAUGHTER LN 2800 COLLINS CREEK DR 5510 Fernview Rd Chase Georgian 8005 GEORGIAN DR 52.3 216,248 $108,600 LED lighting, HVAC Tune-Up, Lighting, Smart Thermostats 24.7 140,916 $126,150 Attic Insulation, HVAC Tune-Up, Smart Thermostats, Lighting 34.4 130,044 $71,274 HVAC Tune-Up, Smart Thermostats, Lighting Plenum Redesign & Remediation, Duct remediation, , Attic Insulation, Lighting, Smart Thermostat, HVAC Tune-Up, Water Savings Devices, ECAD incentive Paid 1257093 72.1 185,701 $73,023 Measures Planned All phases: Plenum Remediation, Attic Insulation, Lighting, Smart Thermostats, HVAC Tune-Up, Advanced Power Strips. Phase 1: Bldgs 1-5 (Paid); Phase 2: Bldgs 6- 10 (Paid); Phase 3: Bldgs 11-15 Phase 1 (Complete): Attic Insulation, Lighting, Plenum Redesign & Remediation, ECAD incentive Phase 2 (In Progress): HVAC Tune- up, Smart Thermostats Phase 1 (Complete): Attic Insulation, Duct Remediation & Seal, Lighting Phase 2: HVAC Tune-Up, Smart Thermostat Phase 1 (Complete): Plenum Redesign & Remediation, Attic Insulation, Phase 2: (In Progress) Lighting Smart Thermostat, HVAC Tune- Up, Water Savings Devices Total # of Units 280 240 223 252 200 280 122 68 Multifamily & Commercial Project Pipeline – Monthly Report 9/9/2022 Program Latest Workflow Enrollmen t (s) # Location Name Installation Address Council District Estimated kW savings Estimated kWh savings Estimated $ Incentive Measures Planned Paid 1249371 Sierra Vista* 51.8 209,158 $122,555 Multifamily Income Qualified Multifamily Income Qualified Paid 1256411 76.8 189,234 $99,530 Multifamily Installation 1262337 153.7 319,794 $192,656 4320 S Congress Ave Chase Village* 8028 GESSNER DR Cortland Southpark Terraces 10101 S 1st St 3 4 5 Total # of Units 238 128 244 Lighting, HVAC Tune-ups, Smart Thermostats Attic Insulation, Duct Remediation & Seal, HVAC Tune-Up, Smart Thermostats, ECAD Incentive Attic Insulation, Duct Remediation & Seal, HVAC Tune-Up, Smart Thermostats, ECAD Incentive * projects in which the RCA Fact Sheet was submitted in a prior month’s report. Fact sheets summarize the projects and are provided when the project is completed. Multifamily & Commercial Project Pipeline – Monthly Report 9/9/2022 Table 2: Commercial and Small Business – Estimated RCA Project Pipeline (for estimated rebates >$66k) Program Latest Workflow Enrollment Number Council District Location Name Installation Address kW savings kWh savings $ Incentive Measures Planned Commercial Installation 1249815 ROUND ROCK ISD – Westwood HS 12400 MELLOW MEADOW DR 6 174.9 650,746 $82,434 Commercial Installation 1269408 AISD 73 SAN MARCOS ST 3 111.6 250,230 $61,978 Commercial Installation 1248944 CAPITOL CENTER 919 CONGRESS AVE 9 76.5 186,581 $72,600 Commercial Paid 1271020 129.4 264,660 $177,605 Chillers, Cooling Towers TRAVIS COUNTY CORRECTIONAL COMPLEX 3614 BILL PRICE RD 100 2 Commercial Paid 1245215 AISD 10 196.1 2,352,835 $80,135 2710 EXPOSITION BLVD * projects in which the RCA Fact Sheet was submitted in a prior month’s report. Fact sheets summarize the projects and are provided when the project is completed. Table 1 & 2 Notes: 1. Rebates, kW, and kWh are subject to change pending final installation scope and site inspections. 2. The above pipeline includes projects that, upon completion of the pre-installation inspection, exceed $66k in estimated rebates. RCA Fact Sheets will be provided for these projects when the project is completed. 3. Estimated kW and kWh savings include estimated transmission and distribution system losses. Cooling Towers, Chillers, Variable Frequency Drives (VFD) Cooling Towers, Chillers, Variable Frequency Drives (VFD), HVAC Chillers, Variable Frequency Drives (VFD) Cooling Towers, Lighting, Variable Frequency Drives (VFD), HVAC MULTIFAMILY REBATE FACT SHEET Chase Georgian Note: Data reflects final installation and inspection; some values may have changed since original proposal scope. Property Name Customer Name Property Address Year Built Average Rent per Floor Plan[1] Number of Rentable Units Housing Type Water Heater Type Electric Utilization Intensity (EUI) Average Electric Utilization Intensity for cohort[2] Chase Georgian GEORGIAN GROUP HOLDINGS LLC 8005 GEORGIAN DR Austin, TX 78753 1983 1x1 = $828.94; 2x2 = $1,077.19 68 Income Qualified. 31 CAP out of 68 units. 45.59% CAP Electric 16.35 10.08 Total Project Costs Total Rebate % of Total Construction Costs Rebate per Unit Project and Rebate $78,308 $73,023 93% $1,074 Note(s) Performed Duct Remediation and Sealing on 68 Furred Down Air Handlers with Electric Heat. Performed duct replacement for 25 units. Installed Attic Insulation on 12720 square feet of roof. Replaced 684 existing Incandescent, Candelabera, Spot or Linear Fluorescent lamps with a like number of LED lamps. Installed 67Ecobee3 lite smart thermostats. Performed HVAC Tune-Up on 68 units with the total tonnage of 108.5 tons. Installed 83 bathroom aerators, 74 showerheads, and 65 kitchen aerators. Received ECAD incentive for having more than three measures installed. Kilowatts (kW) Saved Kilowatt-hours (kWh) Saved $/kW– Estimated Annual Dollar Savings Per Unit[3] Project Annual Savings at 100% Occupancy 72 kW 185701 kWh $ 995/kW $257 Scope of Work Measure Rebate Amount kW Saved kWh Saved Annual Dollar Savings Per Unit[4] Duct Remediation & Seal Duct Replacement Attic Insulation Lighting Smart Thermostats HVAC Tune-Up Water Saving Devices ECAD Incentive $23,800 $2,785 $11,575 $2,052 $10,050 $20,100 $1,360 $1,300 42.7 2.9 8.0 3.4 5.8 6.4 2.7 - 86,196 5,175 4,331 2,147 33,434 25,053 29,366 - Completion Date $/kW $557 $946 $1,444 $608 $1,722 $3,121 $496 - $119 $7 $6 $3 $46 $35 $41 - Measures Performed - Last 10 Years at this property [1] Source: Property management [2] Cohort Type is determined by the year the property is built and the heating type (either gas or electric) [3] Calculation based on 10 cents per kWh. [4] Energy (kWh) and dollars ($) saved per project varies by both the size of the project and the type of heating. Projects with electric heat generally have higher savings than projects with gas heat. Rebate Amount COMMERCIAL REBATE FACT SHEET [AISD] Note: Data reflects final installation and inspection; some values may have changed since original proposal scope. Property Name Customer Name Property Address Total Square Feet Year Built Air Conditioner Tonnage Water Heater Type Total Project Costs Casis Elementary School AISD 2710 Exposition Blvd 91808 1951 >200 tons n/a >$300,000 $80,135 Less than 50% Total Rebate % of Total Construction Costs Note(s) This rebate is for the newly retrofitted Casis Elementary School. The premise includes new cooling towers, VFDs, and LED lighting system. Project Annual Savings Kilowatt (kW) Kilowatt-hours (kWh) $/kW Scope of Work 196.13 kW 2352835 kWh $ 408 /kW Measure Cooling Towers HVAC LED Lighting Variable Frequency Drives Measures Performed in last 10 years at this property Rebate $10,152 $55,552 $13,207 $1224 kW Saved 40.95 100.77 50.71 3.7 kWh Saved 129,188.67 2,080,202 143,436 8.17 $/kW $250/kW $555/kW $264/kW $330/kW Completion Date Rebate Amount COMMERCIAL REBATE FACT SHEET [Travis County Correctional Facility] Note: Data reflects final installation and inspection; some values may have changed since original proposal scope. Property Name Customer Name Property Address Total Square Feet Year Built Air Conditioner Tonnage Water Heater Type Total Project Costs Travis County Correctional Facility The Travis County 3614 Bill Price Rd N/A 2019 2000 tons n/a >$500,000 $195,604 Less than 50% Total Rebate % of Total Construction Costs Note(s) This rebate is for the retrofit project at Travis County Correctional Facility. The facility installed new 2000 tons chillers and new LED Lighting. Project Annual Savings Kilowatt (kW) Kilowatt-hours (kWh) $/kW Scope of Work 135.95 kW 332671.3 kWh $ 1439 /kW Measure Water-Cooled Centrifugal Chiller LED Lighting Limited Time Bonus Offer Measures Performed in last 10 years at this property Rebate $120,000 $30,465 $45,139 kW Saved 13.07 123.38 kWh Saved 136021 579784 $/kW $9230/kW $247/kW Completion Date Rebate Amount