Customer Energy Solutions FY22 Savings Report — original pdf
Backup
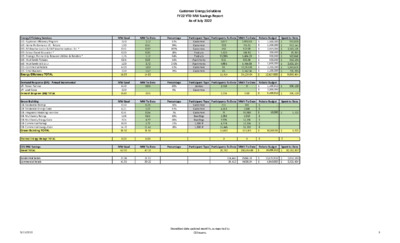
Energy Efficiency Services EES- Appliance Efficiency Program EES- Home Performance ES - Rebate EES- AE Weatherization & CAP Weatherization - D.I. * EES- School Based Education * EES- Strategic Partnership Between Utilities & Retailers * EES- Multifamily Rebates EES- Multifamily WX-D.I.+ EES- Commercial Rebate EES- Small Business Energy Efficiency TOTAL Demand Response (DR) - Annual Incremental DR- Power Partner DR- Load Coop Demand Response (DR) TOTAL Green Building GB- Residential Ratings GB- Residential Energy Code GB- Integrated Modeling Incentive GB- Multifamily Ratings GB- Multifamily Energy Code GB- Commercial Ratings GB- Commercial Energy Code Green Building TOTAL CES MW Savings Grand TOTAL Residential Totals Commercial Totals Customer Energy Solutions FY22 YTD MW Savings Report As of July 2022 Participant Type Participants To Date MWh To Date MW Goal 2.60 1.30 0.53 0.10 1.75 0.65 1.00 6.00 2.00 15.93 MW Goal 6.40 2.00 8.40 MW Goal 0.50 6.21 0.56 1.55 7.04 8.00 14.72 38.57 MW To Date 2.12 0.51 0.57 0.03 1.12 0.36 2.72 5.80 1.57 14.80 MW To Date 3.85 3.85 MW To Date 0.25 5.39 0.04 0.83 4.77 5.79 11.47 28.53 Percentage 82% 39% 107% 28% 64% 55% 272% 97% 79% Percentage 60% 0% Percentage 50% 87% 7% 53% 68% 72% 78% Customers Customers Customers Products Products Apartments Apartments Customers Customers Devices Customers Customers Customers Customers Dwellings Dwellings 1,000 sf 1,000 sf Participant Type Participants To Date MWh To Date Participant Type Participants To Date MWh To Date Spent to Date 3,990.83 715.31 922.09 196.92 5,404.23 632.36 5,755.68 13,764.06 3,742.56 35,124.04 0 0.00 399 7,049 99,980 2,010 12,756 12,134 31,232 165,561 Rebate Budget $ 1,500,000 $ 1,300,000 $ 2,577,000 $ 200,000 $ 900,000 $ 900,000 $ 1,800,000 $ 2,250,000 $ 1,100,000 $ 12,527,000 Spent to Date $ 990,025 $ 912,141 $ 2,181,126 $ 70,793 $ 519,646 $ 352,135 $ 2,521,194 $ 1,544,619 $ 776,785 $ 9,868,464 Rebate Budget $ 1,499,910 $ 2,000,000 $ 3,499,910 $ 306,120 $ 306,120 Rebate Budget $ - $ - $ 10,000 $ - $ - $ - $ - $ 10,000.00 $ 5,723 $ 5,723 3,077 390 452 1,525 95,985 821 4,985 81 83 11,414 2,716 2,716 331 4,163 79 2,253 7,776 4,774 11,445 14,602 0 MW Goal 62.90 MW To Date 47.18 Percentage Participant Type Participants To Date MWh To Date 28,732 200,684.88 Rebate Budget $ 16,036,910 Spent to Date $ 10,180,307 21.04 41.31 16.92 30.22 114,445 26,412 25066.38 75638.04 $ $ 10,676,910 5,350,000 $ $ 7,853,180 2,321,404 Thermal Energy Storage TOTAL 0.00 0.00 0 $ - $ - 9/13/2022 Unaudited data updated monthly, as reported by CES teams. 3 Customer Energy Solutions FY22 YTD MW Savings Report As of July 2022 Percentage 72% 18% Participant Type Participants To Date MWh To Date Incentive Budget Spent to Date 2,024,856 1,629,359 $ 2,500,000 $ 2,750,000 Customers Customers $ $ 8,651 1,502 10,153.00 $ 5,250,000 $ 3,654,215 684 16 405 1105 Participant Type Participants To Date MW Goal 7.00 5.00 12.00 Customers Customers Customers Customers MW To Date 5.03 0.88 2.72 8.63 26,285 444 26,729 275 165 440 Participant Type Participants To Date MWh To Date 165,160.88 467,105.03 632,265.91 MWh To Date 2,051.89 1,335.85 3,387.74 Customer Renewable Solutions Residential Commercial Unincentivized Solar Energy TOTAL GreenChoice Residential Commercial GreenChoice TOTAL Community Solar Market Rate CAP Community Solar TOTAL Energy Efficiency Programs Solar Green Building Notes: AE Weatherization budget excludes rollover. All numbers are unaudited and will be adjusted in line with financial updates. This report has historically been filtered by paid date per enrollment.Beginning this month (June 2022) the EES data is filtered on payment authorization (approval) date Through July, 51% of Single Family homes and 12 Multifamily developments (with a total of 1579 units) receiving AEGB ratings are in SMART Housing developments in the AE service area. 9/13/2022 Unaudited data updated monthly, as reported by CES teams. 3 Customer Energy Solutions FY22 YTD MW Savings Report As of July 2022 MW Saving Goal Tracking Solar Goal Tracking 70.00 60.00 50.00 40.00 30.00 20.00 10.00 0.00 15.85 11.49 8.29 3.22 47.18 43.71 39.83 35.08 29.35 23.99 62.902 8.00 7.00 6.00 5.00 4.00 3.00 2.00 1.00 0.00 7.000 5.000 5.03 3.84 4.04 2.38 2.53 2.12 2.97 1.55 1.10 0.30 0.00 0.06 0.12 0.33 0.33 0.70 0.78 0.88 0.88 0.88 Res Actual Com Actual Res Goal Com Goal Oct Nov Dec Jan Feb Mar May Jun Jul Aug Sep Oct Nov Dec Jan Feb Mar Apr May Jun Jul Aug Sep Apr Goal Actual 9/13/2022 Unaudited data updated monthly, as reported by CES teams. 3