Customer Energy Solutions FY22 Savings Report — original pdf
Backup
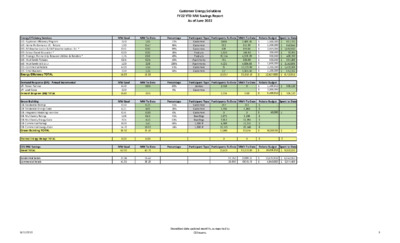
Energy Efficiency Services EES- Appliance Efficiency Program EES- Home Performance ES - Rebate EES- AE Weatherization & CAP Weatherization - D.I. * EES- School Based Education * EES- Strategic Partnership Between Utilities & Retailers * EES- Multifamily Rebates EES- Multifamily WX-D.I.+ EES- Commercial Rebate EES- Small Business Energy Efficiency TOTAL Demand Response (DR) - Annual Incremental DR- Power Partner DR- Load Coop Demand Response (DR) TOTAL Green Building GB- Residential Ratings GB- Residential Energy Code GB- Integrated Modeling Incentive GB- Multifamily Ratings GB- Multifamily Energy Code GB- Commercial Ratings GB- Commercial Energy Code Green Building TOTAL CES MW Savings Grand TOTAL Residential Totals Commercial Totals Customer Energy Solutions FY22 YTD MW Savings Report As of June 2022 Participant Type Participants To Date MWh To Date MW Goal 2.60 1.30 0.53 0.10 1.75 0.65 1.00 6.00 2.00 15.93 MW Goal 6.40 2.00 8.40 MW Goal 0.50 6.21 0.56 1.55 7.04 8.00 14.72 38.57 MW To Date 1.86 0.47 0.53 0.03 0.86 0.35 2.38 5.54 1.36 13.38 MW To Date 3.85 3.85 MW To Date 0.23 4.86 0.00 0.63 4.43 5.41 10.92 26.48 Percentage 72% 36% 99% 28% 49% 53% 238% 92% 68% Percentage 60% 0% Percentage 45% 78% 0% 41% 63% 68% 74% Customers Customers Customers Products Products Apartments Apartments Customers Customers Devices Customers Customers Customers Customers Dwellings Dwellings 1,000 sf 1,000 sf Participant Type Participants To Date MWh To Date Participant Type Participants To Date MWh To Date 3,488.26 651.99 855.66 196.92 4,378.29 600.90 5,005.68 12,775.99 3,365.50 31,319.19 0 0.00 361 6,360 0 1,245 11,794 11,353 29,540 60,654 Rebate Budget Spent to Date 867,735 843,645 1,957,530 70,793 409,790 334,283 2,152,666 1,420,303 657,166 8,713,911 $ 1,500,000 $ 1,300,000 $ 2,577,000 $ 200,000 $ 900,000 $ 900,000 $ 1,800,000 $ 2,250,000 $ 1,100,000 $ 12,527,000 $ $ $ $ $ $ $ $ $ $ Rebate Budget $ 1,499,910 $ 2,000,000 $ 3,499,910 $ 306,120 $ 306,120 Rebate Budget Spent to Date $ - $ - $ 50,000 $ - $ - $ - $ - $ $ - $ - 50,000.00 2,666 362 409 1,525 76,114 791 4,121 76 67 10,017 2,716 2,716 297 3,756 0 1,571 7,262 4,249 10,713 12,886 0 MW Goal 62.90 MW To Date 43.71 Percentage Participant Type Participants To Date MWh To Date 25,619 91,972.89 Rebate Budget Spent to Date 9,020,031 $ 16,076,910 $ 21.04 41.31 15.42 28.29 92,757 23,939 21899.16 70073.73 $ $ 10,676,910 5,350,000 $ $ 6,942,562 2,077,469 Thermal Energy Storage TOTAL 0.00 0.00 0 $ - $ - 8/12/2022 Unaudited data updated monthly, as reported by CES teams. 3 Customer Energy Solutions FY22 YTD MW Savings Report As of June 2022 Percentage 58% 18% Participant Type Participants To Date MWh To Date Incentive Budget Spent to Date 1,697,356 1,393,753 $ 2,500,000 $ 2,750,000 Customers Customers 6,943 1,502 $ $ 8,444.53 $ 5,250,000 $ 3,091,109 553 16 367 936 Participant Type Participants To Date MW Goal 7.00 5.00 12.00 Customers Customers Customers Customers MW To Date 4.04 0.88 2.86 7.77 25,457 437 25,894 307 152 459 Participant Type Participants To Date MWh To Date 137,432.64 414,131.92 551,564.56 MWh To Date 1,753.74 1,062.93 2,816.67 Customer Renewable Solutions Residential Commercial Unincentivized Solar Energy TOTAL GreenChoice Residential Commercial GreenChoice TOTAL Community Solar Market Rate CAP Community Solar TOTAL Energy Efficiency Programs Solar Green Building Notes: AE Weatherization budget excludes rollover. All numbers are unaudited and will be adjusted in line with financial updates. This report has historically been filtered by paid date per enrollment.Beginning this month (June 2022) the EES data is filtered on payment authorization (approval) date Through June, 51% of Single Family homes and 10 Multifamily developments (with a total of 1217 units) receiving AEGB ratings are in SMART Housing developments in the AE service area. 8/12/2022 Unaudited data updated monthly, as reported by CES teams. 3 Customer Energy Solutions FY22 YTD MW Savings Report As of June 2022 MW Saving Goal Tracking Solar Goal Tracking 70.00 60.00 50.00 40.00 30.00 20.00 10.00 0.00 43.71 39.83 35.08 29.35 23.99 15.85 11.49 8.29 3.22 62.902 8.00 7.00 6.00 5.00 4.00 3.00 2.00 1.00 0.00 3.84 4.04 2.38 2.53 2.12 2.97 1.55 1.10 0.30 0.00 0.06 0.12 0.33 0.33 0.70 0.78 0.88 0.88 Res Actual Com Actual Res Goal Com Goal 7.000 5.000 Oct Nov Dec Jan Feb Mar May Jun Jul Aug Sep Oct Nov Dec Jan Feb Mar Apr May Jun Jul Aug Sep Apr Goal Actual 8/12/2022 Unaudited data updated monthly, as reported by CES teams. 3