Multifamily & Commercial Project Pipeline Monthly Report — original pdf
Backup
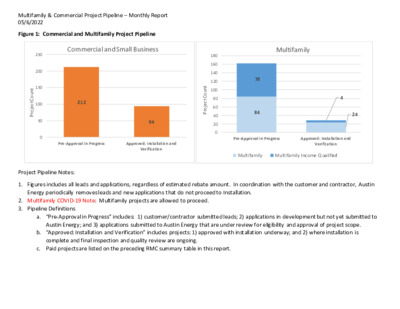
Multifamily & Commercial Project Pipeline – Monthly Report 05/6/2022 Figure 1: Commercial and Multifamily Project Pipeline Commercial and Small Business Multifamily 250 200 150 100 50 0 t n u o C t c e j o r P 180 160 140 120 100 80 60 40 20 0 t n u o C t c e j o r P 78 84 212 94 4 24 Pre-Approval in Progress Approved: Installation and Verification Pre-Approval in Progress Approved: Installation and Verification Multifamily Multifamily Income Qualified Project Pipeline Notes: 1. Figures includes all leads and applications, regardless of estimated rebate amount. In coordination with the customer and contractor, Austin Energy periodically removes leads and new applications that do not proceed to Installation. 2. Multifamily COVID-19 Note: Multifamily projects are allowed to proceed. 3. Pipeline Definitions a. “Pre-Approval in Progress” includes: 1) customer/contractor submitted leads; 2) applications in development but not yet submitted to Austin Energy; and 3) applications submitted to Austin Energy that are under review for eligibility and approval of project scope. b. “Approved: Installation and Verification” includes projects: 1) approved with installation underway; and 2) where installation is complete and final inspection and quality review are ongoing. c. Paid projects are listed on the preceding RMC summary table in this report. Multifamily & Commercial Project Pipeline – Monthly Report 05/6/2022 Table 1: Multifamily and Multifamily Income Qualified – Estimated RCA Project Pipeline (for estimated rebates >$66k) Program Latest Workflow Enrollment( s) # Location Name Installation Address Council District Estimate d kW savings Estimated kWh savings Estimated $ Incentive Measures Planned Installation 1231787, 1231196, 1231197 Trove Eastside* 2201 Montopolis Dr 3 216.0 593,241 $281,549 Installation 1245134, 1263660 Chevy Chase Downs 2504 Huntwick Dr 3 332.3 732,428 $273,762 Installation 1240491, 1263326 The Social Apartments 1817 E Oltorf St 204.1 295,130 $245,248 Installation 1254736, 1255009 Coppertree Apartments 2425 Cromwell Cir 329.5 853,125 $240,742 Installation 1249371 Sierra Vista 57.1 213,843 $136,180 All phases: Plenum Remediation, Attic Insulation, Lighting, Smart Thermostats, HVAC Tune-Up, Advanced Power Strips. Phase 1: Bldgs 1-5 (Paid); Phase 2: Bldgs 6-10; Phase 3: Bldgs 11-15 Phase 1 (Complete): Attic Insulation, Lighting, Plenum Redesign & Remediation, ECAD incentive Phase 2 (In Progress): HVAC Tune-up, Smart Thermostats Phase 1 (Complete): Attic Insulation, Duct Remediation & Seal, Lighting Phase 2: HVAC Tune-Up, Smart Thermostat Phase 1 (Complete): Plenum Redesign & Remediation, Attic Insulation, Phase 2: Lighting Smart Thermostat, HVAC Tune-Up, Water Savings Devices Lighting, HVAC Tune-ups, Smart Thermostats 3 3 3 5 3 4 4 Installation 1251538 Installation 1252104 Installation 1256411 4320 S Congress Ave 815 W SLAUGHTER LN 2800 COLLINS CREEK DR 8028 GESSNER DR 8005 GEORGIAN DR Trails at the Park ROSEMONT AT OAK VALLEY Chase Village Chase Georgian 52.3 216,248 $108,600 LED lighting, HVAC Tune-Up, Lighting, Smart Thermostats 24.7 140,916 $126,150 Attic Insulation, HVAC Tune-Up, Smart Thermostats, Lighting 39.1 139,454 $79,015 Duct Remediation & Seal, HVAC Tune- Up, Smart Thermostats Plenum Redesign & Remediation, Attic Insulation, Lighting, Smart Thermostat, HVAC Tune-Up, Water Savings Devices Installation 1257093 51.1 147,564 $70,594 Multifamily Income Qualified Multifamily Income Qualified Multifamily Income Qualified Multifamily Income Qualified Multifamily Income Qualified Multifamily Income Qualified Multifamily Income Qualified Multifamily Income Qualified Multifamily Income Qualified Total # of Units 280 240 223 252 238 200 280 128 68 Multifamily & Commercial Project Pipeline – Monthly Report 05/6/2022 Multifamily Income Qualified Multifamily Income Qualified Program Latest Workflow Enrollment( s) # Location Name Installation Address Council District Estimate d kW savings Estimated kWh savings Estimated $ Incentive Paid 1249767 Sierra Ridge 3 38.2 139,395 $75,611 Measures Planned HVAC Tune-Up, Lighting, Smart Thermostats Total # of Units 149 Paid 1251567 The Royce at 8100 None 75.8 354,536 $172,229 HVAC Tune-Up, Smart Thermostats 376 Multifamily Paid 1225046, 1254626 Park at Crestview 7 331.2 666,308 $290,376 Phase 1 (Complete): Duct Remediation & Seal, Lighting, Smart Thermostats, HVAC Tune-Up, Water Saving Devices, Phase 2: (Complete): Attic insulation 248 * projects in which the RCA Fact Sheet was submitted in a prior month’s report. Fact sheets summarize the projects and are provided when the project is completed. 201 W St Elmo Rd 8100 ANDERSON MILL RD 8220 Research Blvd Svrd SB Multifamily & Commercial Project Pipeline – Monthly Report 05/6/2022 Council District 6 1 4 Table 2: Commercial and Small Business – Estimated RCA Project Pipeline (for estimated rebates >$66k) Program Latest Workflow Enrollment Number Location Name Installation Address kW savings kWh savings $ Incentive Measures Planned Commercial Installation 1249815 ROUND ROCK ISD – Westwood HS 12400 MELLOW MEADOW DR 174.9 650,746 $82,434 Commercial Paid 1255630 Commercial Paid 1255631 DELL TECHNOLOGIES 701E PARMER LN PS3 DELL TECHNOLOGIES 1300 PARK CENTER DR 187.0 928,169 $73,560 393.0 3,027,319 $97,439 * projects in which the RCA Fact Sheet was submitted in a prior month’s report. Fact sheets summarize the projects and are provided when the project is completed. Table 1 & 2 Notes: 1. Rebates, kW, and kWh are subject to change pending final installation scope and site inspections. 2. The above pipeline includes projects that, upon completion of the pre-installation inspection, exceed $66k in estimated rebates. RCA Fact Sheets will be provided for these projects when the project is completed. 3. Estimated kW and kWh savings include estimated transmission and distribution system losses. Cooling Towers, Chillers, Variable Frequency Drives (VFD), Frequency Drives Uninterrupted Power Supply, Chiller Uninterrupted Power Supply MULTIFAMILY REBATE FACT SHEET Sierra Ridge Apartments Property Name Customer Name Property Address Year Built Average Rent per Floor Plan[1] Number of Rentable Units Note: Data reflects final installation and inspection; some values may have changed since original proposal scope. Sierra Ridge Apartments SAINT ELMO MUTUAL HOUSING CORP 201 W ST ELMO RD Austin, TX 78745 1970 148 Income Qualified. Non-Profit - Foundation Communities property Income Level A, B, C Income Restricted Section 8 Voucher 149 Total Units 149 Low-Income Units Section 8 Voucher Electric 6.21 10.08 Water Heater Type Electric Utilization Intensity (EUI) Average Electric Utilization Intensity for cohort[2] Housing Type Total Project Costs Total Rebate % of Total Construction Costs Rebate per Unit Project and Rebate $75,611 $75,611 100% $511 Note(s) Replace 2058 existing Incandescent, Candelabera, Spot or Linear Fluorescent lamps with a like number of LED lamps. Install 15 3Nest Thermostat E smart thermostats. Perform HVAC Tune-Up on 153 units with the total tonnage of 244.5 tons. Kilowatts (kW) Saved Kilowatt-hours (kWh) Saved $/kW– Estimated Annual Dollar Savings Per Unit[3] Project Annual Savings at 100% Occupancy 38 kW 140489 kWh $ 1979/kW $89 Scope of Work Measure Rebate Amount kW Saved kWh Saved $/kW Annual Dollar Savings Per Unit[4] $905 $1,722 $2,982 $5 $48 $36 Lighting Smart Thermostats HVAC Tune-Up $9,381 $22,950 $43,280 10.4 13.3 14.5 7,685 76,349 56,455 Completion Date Measures Performed - Last 10 Years at this property Rebate Amount Small Business lighting HVAC replacement - 18 units HVAC replacement - 4 units [1] Source: CoStar [2] Cohort Type is determined by the year the property is built and the heating type (either gas or electric) [3] Calculation based on 10 cents per kWh. [4] Energy (kWh) and dollars ($) saved per project varies by both the size of the project and the type of heating. Projects with electric heat generally have higher savings than projects with gas heat. 12/4/2013 5/11/2014 4/1/2015 $4,500 $1,600 Note: Data reflects final installation and inspection; some values may have changed since original proposal scope. MULTIFAMILY REBATE FACT SHEET The Royce at 8100 The Royce at 8100 HOUSING AUTHORITY OF THE CITY OF AUSTIN 8100 ANDERSON MILL RD, AUSTIN, TX 78729 2015 Property Name Customer Name Property Address Year Built Average Rent per Floor Plan[1] Number of Rentable Units Housing Type 376 Income qualified. Not for profit owners. Owned by HOUSING AUTHORITY OF AUSTIN, XV - Other Exemptions - Public property for housing indigent persons. Electric Not reported Not reported Water Heater Type Electric Utilization Intensity (EUI) Average Electric Utilization Intensity for cohort[2] Total Project Costs Total Rebate % of Total Construction Costs Rebate per Unit Project and Rebate $172,656 $172,229 100% $458 Note(s) Install 372Honeywell Lyric T-Series smart thermostats. Perform HVAC Tune-Up on 384 units with the total tonnage of 731.5 tons. Kilowatts (kW) Saved Kilowatt-hours (kWh) Saved $/kW– Estimated Annual Dollar Savings Per Unit[3] Project Annual Savings at 100% Occupancy 76 kW 354536 kWh $2,241/kW $89 Scope of Work Measure Rebate Amount kW Saved kWh Saved $/kW Smart Thermostats HVAC Tune-Up Income Qualified Limited Time Bonus $55,800 $114,155 $2,274 32.4 43.4 - 185,634 168,902 - Completion Date Measures Performed - Last 10 Years at this property Rebate Amount Annual Dollar Savings Per Unit[4] $1,722 $2,629 - $46 $42 - [1] Source: CoStar [2] Cohort Type is determined by the year the property is built and the heating type (either gas or electric) [3] Calculation based on 10 cents per kWh. [4] Energy (kWh) and dollars ($) saved per project varies by both the size of the project and the type of heating. Projects with electric heat generally have higher savings than projects with gas heat. COMMERCIAL REBATE FACT SHEET Dell Technologies Note: Data reflects final installation and inspection; some values may have changed since original proposal scope. Property Name Customer Name Property Address Total Square Feet Year Built DATA CENTER DELL TECHNOLOGIES 1300 PARK CENTER DR 121,785 1999 Total Project Costs Total Rebate % of Total Construction Costs Note(s) Dell Technologies installed 20 high efficiency Uninterrupted Power Supply units at their Park Center Dr facility. $97,439 7% $1,400,000 Project Annual Savings Kilowatt (kW) Kilowatt-hours (kWh) $/kW Scope of Work 393 3,027,318 $248 Measure Rebate kW Saved kWh Saved Uninterrupted Power Supply $97,439 393 3,027,318 $/kW $248 Measures Performed in last 10 years at this property - Completion Date - Rebate Amount - COMMERCIAL REBATE FACT SHEET Dell Technologies Note: Data reflects final installation and inspection; some values may have changed since original proposal scope. PS3B DATA CENTER DELL TECHNOLOGIES 701 E PARMER LN 709,789 2001 Property Name Customer Name Property Address Total Square Feet Year Built Total Project Costs Total Rebate % of Total Construction Costs Note(s) Dell Technologies installed 5 high efficiency Uninterrupted Power Supply units and a high efficiency chiller at their Parmer Ln location. $73,560 6% $1,400,000 Project Annual Savings Kilowatt (kW) Kilowatt-hours (kWh) $/kW Scope of Work 187.0 928,169 $393 Measure Rebate kW Saved kWh Saved Chiller Uninterrupted Power Supply $49,200 $24,359 88.79 98.25 171,339 756,829 $/kW $554 $248 Measures Performed in last 10 years at this property - Completion Date - Rebate Amount -