Customer Energy Solutions FY22 Savings Report — original pdf
Backup
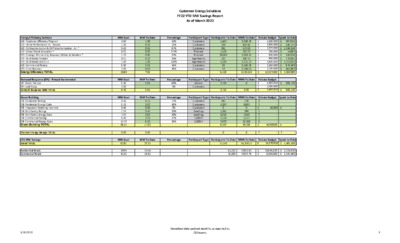
Energy Efficiency Services EES- Appliance Efficiency Program EES- Home Performance ES - Rebate EES- AE Weatherization & CAP Weatherization - D.I. * EES- School Based Education * EES- Strategic Partnership Between Utilities & Retailers * EES- Multifamily Rebates EES- Multifamily WX-D.I.+ EES- Commercial Rebate EES- Small Business Energy Efficiency TOTAL Demand Response (DR) - Annual Incremental DR- Power Partner DR- Load Coop Demand Response (DR) TOTAL Green Building GB- Residential Ratings GB- Residential Energy Code GB- Integrated Modeling Incentive GB- Multifamily Ratings GB- Multifamily Energy Code GB- Commercial Ratings GB- Commercial Energy Code Green Building TOTAL CES MW Savings Grand TOTAL Residential Totals Commercial Totals Customer Energy Solutions FY22 YTD MW Savings Report As of March 2022 Participant Type Participants To Date MWh To Date MW Goal 2.60 1.30 0.53 0.01 1.75 0.65 1.00 6.00 2.00 15.84 MW Goal 6.40 2.00 8.40 MW Goal 0.50 6.21 0.56 1.55 7.04 8.00 14.72 38.57 MW To Date 1.08 0.30 0.35 0.03 0.56 0.23 1.03 3.35 0.95 7.88 MW To Date 3.85 3.85 MW To Date 0.13 2.97 0.00 0.46 2.81 2.94 8.30 17.62 Percentage 42% 23% 67% 277% 32% 35% 103% 56% 48% Percentage 60% 0% Percentage 27% 48% 0% 30% 40% 37% 56% Customers Customers Customers Products Products Apartments Apartments Customers Customers Devices Customers Customers Customers Customers Dwellings Dwellings 1,000 sf 1,000 sf Participant Type Participants To Date MWh To Date Participant Type Participants To Date MWh To Date 2,049.78 420.66 572.63 196.92 2,833.23 508.55 2,171.72 3,540.78 2,258.37 14,552.64 0 0.00 220 3,890 0 790 7,056 5,777 22,483 40,216 Rebate Budget Spent to Date 497,045 549,155 1,246,359 55,882 243,016 170,301 1,257,042 679,593 461,987 5,160,380 $ 1,500,000 $ 1,300,000 $ 2,577,000 $ 200,000 $ 900,000 $ 900,000 $ 1,800,000 $ 2,250,000 $ 1,100,000 $ 12,527,000 $ $ $ $ $ $ $ $ $ $ Rebate Budget $ 1,499,910 $ 2,000,000 $ 3,499,910 $ 306,120 $ 306,120 Rebate Budget Spent to Date $ - $ - $ 50,000 $ - $ - $ - $ - $ $ - $ - 50,000.00 1,562 233 261 1,523 50,689 531 2,239 33 47 6,429 2,716 2,716 181 2,297 0 1,016 4,910 2,124 7,870 8,404 0 MW Goal 62.81 MW To Date 29.35 Percentage Participant Type Participants To Date MWh To Date 17,549 54,768.57 Rebate Budget Spent to Date 5,466,500 $ 16,076,910 $ 20.95 41.31 10.54 18.81 62,232 16,000 12863.81 41904.76 $ $ 10,676,910 5,350,000 $ $ 4,324,920 1,141,580 Thermal Energy Storage TOTAL 0.00 0.00 0 $ - $ - 5/10/2022 Unaudited data updated monthly, as reported by CES teams. 3 Customer Energy Solutions FY22 YTD MW Savings Report As of March 2022 Percentage 36% 14% Participant Type Participants To Date MWh To Date Incentive Budget Spent to Date 1,082,084 821,001 $ 2,500,000 $ 2,750,000 Customers Customers $ $ 4,335 1,195 5,530.00 $ 5,250,000 $ 1,903,085 331 11 263 605 Participant Type Participants To Date MW Goal 7.00 5.00 12.00 Customers Customers Customers Customers MW To Date 2.53 0.70 1.40 4.63 23,744 423 24,167 246 162 408 Participant Type Participants To Date MWh To Date 85,509.11 276,637.39 362,146.50 MWh To Date 1,021.13 741.00 1,762.13 Customer Renewable Solutions Residential Commercial Unincentivized Solar Energy TOTAL GreenChoice Residential Commercial GreenChoice TOTAL Community Solar Market Rate CAP Community Solar TOTAL Energy Efficiency Programs Solar Green Building Notes: AE Weatherization budget excludes rollover. All numbers are unaudited and will be adjusted in line with financial updates. This report has historically been filtered by paid date per enrollment, starting June 2022 we will be filtering on payment authorization (approval) date Through March, 49% of Single Family homes and 6 Multifamily developments (with a total of 662 units) receiving AEGB ratings are in SMART Housing developments in the AE service area. 5/10/2022 Unaudited data updated monthly, as reported by CES teams. 3 MW Saving Goal Tracking Solar Goal Tracking Customer Energy Solutions FY22 YTD MW Savings Report As of March 2022 62.812 8.00 7.00 6.00 5.00 4.00 3.00 2.00 1.00 0.00 2.38 2.53 2.12 1.55 1.10 0.30 0.00 0.06 0.12 0.33 0.33 0.70 7.000 5.000 70.00 60.00 50.00 40.00 30.00 20.00 10.00 0.00 29.35 11.49 8.29 15.85 3.22 Oct Nov Dec Jan Feb Mar May Jun Jul Aug Sep Oct Nov Dec Jan Feb Mar Apr May Jun Jul Aug Sep Apr Goal Actual Res Actual Com Actual Res Goal Com Goal 5/10/2022 Unaudited data updated monthly, as reported by CES teams. 3