Multifamily & Commercial Project Pipeline Monthly Report — original pdf
Backup
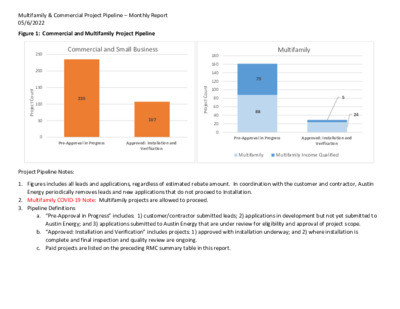
Multifamily & Commercial Project Pipeline – Monthly Report 05/6/2022 Figure 1: Commercial and Multifamily Project Pipeline Commercial and Small Business Multifamily 250 200 150 100 50 0 t n u o C t c e o r P j 180 160 140 120 100 80 60 40 20 0 t n u o C t c e o r P j 73 88 235 107 5 24 Pre-Approval in Progress Approved: Installation and Verification Pre-Approval in Progress Approved: Installation and Verification Multifamily Multifamily Income Qualified Project Pipeline Notes: 1. Figures includes all leads and applications, regardless of estimated rebate amount. In coordination with the customer and contractor, Austin Energy periodically removes leads and new applications that do not proceed to Installation. 2. Multifamily COVID-19 Note: Multifamily projects are allowed to proceed. 3. Pipeline Definitions a. “Pre-Approval in Progress” includes: 1) customer/contractor submitted leads; 2) applications in development but not yet submitted to Austin Energy; and 3) applications submitted to Austin Energy that are under review for eligibility and approval of project scope. b. “Approved: Installation and Verification” includes projects: 1) approved with installation underway; and 2) where installation is complete and final inspection and quality review are ongoing. c. Paid projects are listed on the preceding RMC summary table in this report. Multifamily & Commercial Project Pipeline – Monthly Report 05/6/2022 Table 1: Multifamily and Multifamily Income Qualified – Estimated RCA Project Pipeline (for estimated rebates >$66k) Program Latest Workflow Enrollment(s) # Location Name Installation Address Council District Estimated kW savings Estimated kWh savings Estimated $ Incentive Measures Planned Total # of Units Multifamily Installation 1225046, 1254626 Park at Crestview 8220 Research Blvd Svrd SB 7 331.2 666,308 $290,376 Multifamily Income Qualified Installation 1231787, 1231196, 1231197 Trove Eastside* 2201 Montopolis Dr 3 216.0 593,241 $281,549 Installation 1245134, 1263660 Chevy Chase Downs 2504 Huntwick Dr 3 332.3 732,428 $273,762 Installation 1240491, 1263326 The Social Apartments 1817 E Oltorf St 204.1 295,130 $245,248 Installation 1249767 Sierra Ridge 24.0 60,402 $65,360 Installation 1254736, 1255009 Coppertree Apartments 3 329.5 853,125 $240,742 3 3 201 W St Elmo Rd 2425 Cromwell Cir Multifamily Income Qualified Multifamily Income Qualified Multifamily Income Qualified Multifamily Income Qualified Multifamily Income Qualified Installation 1251567 None 70.8 336,284 $178,411 HVAC Tune-Up, Smart Thermostats 376 The Royce at 8100 8100 ANDERSON MILL RD Phase 1 (Complete): Duct Remediation & Seal, Lighting, Smart Thermostats, HVAC Tune-Up, Water Saving Devices, Phase 2: Attic insulation All phases: Plenum Remediation, Attic Insulation, Lighting, Smart Thermostats, HVAC Tune-Up, Advanced Power Strips. Phase 1: Bldgs 1-5 (Paid); Phase 2: Bldgs 6- 10; Phase 3: Bldgs 11-15 Phase 1 (Complete): Attic Insulation, Lighting, Plenum Redesign & Remediation, ECAD incentive Phase 2 (In Progress): HVAC Tune- up, Smart Thermostats Phase 1 (Complete): Attic Insulation, Duct Remediation & Seal, Lighting Phase 2: HVAC Tune-Up, Smart Thermostat HVAC Tune-Up, Lighting, Smart Thermostat for front office Phase 1 (Complete): Plenum Redesign & Remediation, Attic Insulation, Phase 2: Lighting Smart Thermostat, HVAC Tune-Up, Water Savings Devices 248 280 240 223 149 252 Multifamily & Commercial Project Pipeline – Monthly Report 05/6/2022 Program Latest Workflow Enrollment(s) # Location Name Installation Address Council District Estimated kW savings Estimated kWh savings Estimated $ Incentive Measures Planned Total # of Units Installation 1249371 Sierra Vista 57.1 213,843 $136,180 Lighting, HVAC Tune-ups, Smart Thermostats Installation 1251538 Installation 1252104 Trails at the Park ROSEMONT AT OAK VALLEY 4320 S Congress Ave 815 W SLAUGHTER LN 2800 COLLINS CREEK DR 52.3 216,248 $108,600 LED lighting, HVAC Tune-Up, Lighting, Smart Thermostats 24.7 140,916 $126,150 Attic Insulation, HVAC Tune-Up, Smart Thermostats, Lighting Installation 1256411 Chase Village 8028 GESSNER DR 39.1 139,454 $79,015 Installation 1257093 51.1 147,564 $70,594 Chase Georgian 8005 GEORGIAN DR Paid 1246412 Palms on Lamar* 8602 N Lamar Blvd 448.5 1,005,796 $292,632 Paid 1249896 4 126.7 263,362 $105,907 South Point Apartments* 9121 North Plaza Duct Remediation & Seal, HVAC Tune-Up, Smart Thermostats Plenum Redesign & Remediation, Attic Insulation, Lighting, Smart Thermostat, HVAC Tune-Up, Water Savings Devices Plenum Redesign & Remediation, Smart Thermostats, HVAC replacement for remaining 356 out of 476 units. Phase 1 (Complete): Attic Insulation, Lighting, Plenum Redesign & Remediation, Water Savings Devices Phase 2 (Cancelled): HVAC Tune- ups, Smart Thermostats * projects in which the RCA Fact Sheet was submitted in a prior month’s report. Fact sheets summarize the projects and are provided when the project is completed. 238 200 280 128 68 356 90 3 5 3 4 4 4 Multifamily Income Qualified Multifamily Income Qualified Multifamily Income Qualified Multifamily Income Qualified Multifamily Income Qualified Multifamily Income Qualified Multifamily Income Qualified Multifamily & Commercial Project Pipeline – Monthly Report 05/6/2022 Table 2: Commercial and Small Business – Estimated RCA Project Pipeline (for estimated rebates >$66k) Program Latest Workflow Enrollment Number Council District Location Name Installation Address kW savings kWh savings $ Incentive Measures Planned Commercial Pre Inspection 1248165 State TFC 1601 Congress Office Bldg. 715.2 2,232,221 $243,739 Lighting New Construction Commercial Installation 1245215 AISD – Casis Elementary 2710 EXPOSITION BLVD 10 81.8 771,585 $69,438 Commercial Installation 1249815 ROUND ROCK ISD – Westwood HS 12400 MELLOW MEADOW DR 6 174.9 650,746 $82,434 Cooling Tower, HVAC Cooling Towers, Chillers, Variable Frequency Drives (VFD), Frequency Drives * projects in which the RCA Fact Sheet was submitted in a prior month’s report. Fact sheets summarize the projects and are provided when the project is completed. Table 1 & 2 Notes: 1. Rebates, kW, and kWh are subject to change pending final installation scope and site inspections. 2. The above pipeline includes projects that, upon completion of the pre-installation inspection, exceed $66k in estimated rebates. RCA Fact Sheets will be provided for these projects when the project is completed. 3. Estimated kW and kWh savings include estimated transmission and distribution system losses. MULTIFAMILY REBATE FACT SHEET Coppertree Apartments Note: Data reflects final installation and inspection; some values may have changed since original proposal scope. Coppertree Apartments DTI Properties 2425 CROMWELL CIR Austin, TX 78741 1x1 = $881.53, 2x2 = $1,085.30 1971 252 Electric Income Qualified: 95 CAP customers out of 252 units. 37% CAP. Electric Utilization Intensity (EUI) Meter Data Not Found Average Electric Utilization Intensity for cohort[2] 10.67 Property Name Customer Name Property Address Year Built Average Rent per Floor Plan[1] Number of Rentable Units Housing Type Water Heater Type Total Project Costs Total Rebate % of Total Construction Costs Rebate per Unit Project and Rebate $156,654 $156,654 100% $622 Note(s) Performed Duct Remediation and Sealing on 224 Furred Down Air Handlers with Electric Heat. Install Attic Insulation on 60,686 square feet of roof. Replace 1,843 existing Incandescent, Candelabera, Spot or Linear Fluorescent lamps with a like number of LED lamps. Performed ECAD audit Kilowatts (kW) Saved Kilowatt-hours (kWh) Saved $/kW– Estimated Annual Dollar Savings Per Unit[3] Project Annual Savings at 100% Occupancy 444 kW 804547 kWh $ 336/kW $300 Scope of Work Measure Rebate Amount kW Saved kWh Saved $/kW Annual Dollar Savings Per Unit[4] Duct Remediation & Seal Attic Insulation Lighting ECAD Incentive Income Qualified Limited Time Bonus $78,400 $60,079 $7,875 $2,500 $7,800 Measures Performed - Last 10 Years at this property 386.0 49.0 8.6 - - 778,393 20,662 5,492 - - Completion Date $203 $1,226 $912 - - $290 $8 $2 - - Rebate Amount [1] Source: Property Management [2] Cohort Type is determined by the year the property is built and the heating type (either gas or electric) [3] Calculation based on 10 cents per kWh. [4] Energy (kWh) and dollars ($) saved per project varies by both the size of the project and the type of heating. Projects with electric heat generally have higher savings than projects with gas heat. MULTIFAMILY REBATE FACT SHEET South Point Apartments Property Name Customer Name Property Address Year Built Note: Data reflects final installation and inspection; some values may have changed since original proposal scope. South Point Apartments AUSTIN SAN LEON LLC 9121 NORTH PLAZA Austin, TX 78753 Income qualified: 42 CAP customers out of 90 units. 46.67% CAP Average Rent per Floor Plan[1] Number of Rentable Units Housing Type Water Heater Type Electric Utilization Intensity (EUI) Average Electric Utilization Intensity for cohort[2] Total Project Costs Total Rebate % of Total Construction Costs Rebate per Unit 1985 Pending 90 Electric 12.76 10.67 $65,407 $65,407 100% $727 Note(s) Project and Rebate Perform Duct Remediation and Sealing on 90 Furred Down Air Handlers with Electric Heat. Install Attic Insulation on 30656 square feet of roof. Replace 970 existing Incandescent, Candelabera, Spot or Linear Fluorescent lamps with a like number of LED lamps. Kilowatts (kW) Saved Kilowatt-hours (kWh) Saved $/kW– Estimated Annual Dollar Savings Per Unit[3] Project Annual Savings at 100% Occupancy 111 kW 186,356 kWh $592/kW $195 Scope of Work Measure Rebate Amount kW Saved kWh Saved $/kW Annual Dollar Savings Per Unit[4] Duct Remediation & Seal Attic Insulation Lighting Water Saving Devices $28,350 $32,802 $2,910 $1,345 71.3 31.7 4.8 2.7 Measures Performed - Last 10 Years at this property 143,843 10,438 3,044 29,031 Completion Date $397 $1,033 $608 $496 $150 $11 $3 $30 Rebate Amount [1] Source: CoStar [2] Cohort Type is determined by the year the property is built and the heating type (either gas or electric) [3] Calculation based on 10 cents per kWh. [4] Energy (kWh) and dollars ($) saved per project varies by both the size of the project and the type of heating. Projects with electric heat generally have higher savings than projects with gas heat.