Customer Energy Solutions FY22 Savings Report — original pdf
Backup
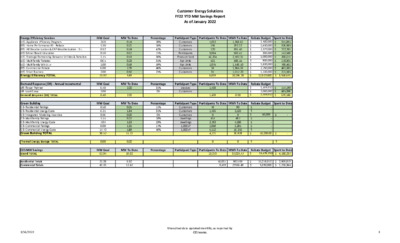
Customer Energy Solutions FY22 YTD MW Savings Report As of January 2022 Energy Efficiency Services EES- Appliance Efficiency Program EES- Home Performance ES - Rebate EES- AE Weatherization & CAP Weatherization - D.I. EES-School Based Education EES- Strategic Partnership Between Utilities & Retailers EES- Multifamily Rebates EES- Multifamily WX-D.I.+ EES- Commercial Rebate EES- Small Business Energy Efficiency TOTAL Demand Response (DR) - Annual Incremental DR- Power Partner DR- Load Coop Demand Response (DR) TOTAL Green Building GB- Residential Ratings GB- Residential Energy Code GB- Integrated Modeling Incentive GB- Multifamily Ratings GB- Multifamily Energy Code GB- Commercial Ratings GB- Commercial Energy Code Green Building TOTAL CES MW Savings Grand TOTAL Residential Totals Commercial Totals MW Goal 2.60 1.30 0.57 0.10 1.75 0.65 1.00 6.00 2.00 15.97 MW Goal 6.40 2.00 8.40 MW Goal 0.50 6.21 0.56 1.55 7.04 8.00 14.72 38.57 MW To Date 0.74 0.21 0.24 0.07 0.53 0.23 0.59 2.79 0.50 5.89 MW To Date 2.00 2.00 MW To Date 0.05 1.94 0.00 0.27 1.63 1.35 5.89 11.13 Percentage 28% 16% 42% 71% 30% 35% 59% 46% 25% Percentage 31% 0% Percentage 11% 31% 0% 18% 23% 17% 40% Participant Type Participants To Date MWh To Date Rebate Budget Spent to Date 341,895 376,585 777,783 142,588 208,071 170,301 798,461 461,383 271,585 3,548,651 Customers Customers Customers Participants Products Sold Apt Units Apt Units Customers Customers 1,500,000 1,600,000 2,577,000 200,000 1,000,000 900,000 1,800,000 2,250,000 1,100,000 12,927,000 1,368.66 297.17 396.40 502.47 2,592.36 508.55 1,549.50 1,964.38 1,017.20 10,196.70 $ $ $ $ $ $ $ $ $ $ 1,032 158 170 3,884 46,204 531 1,075 18 31 6,899 $ $ $ $ $ $ $ $ $ $ Participant Type Participants To Date MWh To Date Rebate Budget Participant Type Participants To Date MWh To Date Rebate Budget Spent to Date Devices Customers Customers Customers Customers Dwellings Dwellings 1,000 sf 1,000 sf 1,403 1,403 78 1,496 0 414 2,783 1,059 5,110 4,771 0 $ $ $ $ $ $ $ $ $ $ $ $ 1,499,910 2,000,000 3,499,910 $ $ $ 154,190 485,396 639,586 - - 50,000 $ - - - - 50,000.00 $ - - - $ - 0.00 90 2,533 0 487 4,188 3,285 16,246 26,828 0 MW Goal 62.94 MW To Date 19.02 Percentage Participant Type Participants To Date MWh To Date Rebate Budget Spent to Date 4,188,237 $ 16,476,910 37,024.47 13,073 $ 21.08 41.31 6.60 12.42 56,031 9,415 9837.98 27186.49 $ $ 11,076,910 5,350,000 $ $ 2,969,873 1,218,364 Thermal Energy Storage TOTAL 0.00 0.00 3/14/2022 Unaudited data updated monthly, as reported by CES teams. 3 Customer Energy Solutions FY22 YTD MW Savings Report As of January 2022 Percentage 30% 7% Participant Type Participants To Date MWh To Date Incentive Budget Spent to Date 989,584 532,664 $ 2,500,000 $ 2,750,000 Customers Customers $ $ 3,613 575 4,188.00 $ 5,250,000 $ 1,522,248 270 6 144 420 Participant Type Participants To Date MW Goal 7.00 5.00 12.00 Customers Customers Customers Customers MW To Date 2.12 0.33 0.97 3.42 23,242 422 23,664 246 161 407 Participant Type Participants To Date MWh To Date 70,878.89 232,475.19 303,354.08 MWh To Date 857.04 643.12 1,500.16 Customer Renewable Solutions Residential Commercial Unincentivized Solar Energy TOTAL GreenChoice Residential Commercial GreenChoice TOTAL Community Solar Market Rate CAP Community Solar TOTAL Energy Efficiency Programs Solar Green Building Through January, 60% of Single Family homes and 4 Multifamily developments (with a total of 414 units) receiving AEGB ratings are in SMART Housing developments in the AE service area. Notes: AE Weatherization budget excludes rollover. All numbers are unaudited and will be adjusted in line with financial updates. 3/14/2022 Unaudited data updated monthly, as reported by CES teams. 3 MW Saving Goal Tracking Solar Goal Tracking 7.000 5.000 70.00 60.00 50.00 40.00 30.00 20.00 10.00 0.00 19.02 11.49 8.29 3.22 Oct Nov Dec Jan Feb Mar Apr May Jun Jul Aug Sep Oct Nov Dec Jan Feb Mar Apr May Jun Jul Aug Sep Actual Goal Res Actual Com Actual Res Goal Com Goal Customer Energy Solutions FY22 YTD MW Savings Report As of January 2022 62.942 8.00 7.00 6.00 5.00 4.00 3.00 2.00 1.00 0.00 2.12 1.55 1.10 0.30 0.00 0.06 0.12 0.33 3/14/2022 Unaudited data updated monthly, as reported by CES teams. 3