Customer Energy Solutions FY22 Savings Report — original pdf
Backup
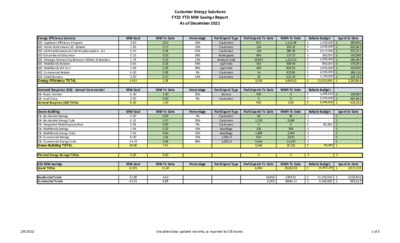
Customer Energy Solutions FY22 YTD MW Savings Report As of December 2021 Energy Efficiency Services EES- Appliance Efficiency Program EES- Home Performance ES - Rebate EES- AE Weatherization & CAP Weatherization - D.I. EES-School Based Education EES- Strategic Partnership Between Utilities & Retailers EES- Multifamily Rebates EES- Multifamily WX-D.I.+ EES- Commercial Rebate EES- Small Business Energy Efficiency TOTAL Demand Response (DR) - Annual Incremental DR- Power Partner DR- Load Coop Demand Response (DR) TOTAL Green Building GB- Residential Ratings GB- Residential Energy Code GB- Integrated Modeling Incentive GB- Multifamily Ratings GB- Multifamily Energy Code GB- Commercial Ratings GB- Commercial Energy Code Green Building TOTAL CES MW Savings Grand TOTAL Residential Totals Commercial Totals MW Goal 2.60 1.30 0.57 0.10 1.75 0.65 1.00 6.00 2.00 15.97 MW Goal 6.40 2.00 8.40 MW Goal 0.50 6.21 0.56 1.55 7.04 8.00 14.72 38.58 MW To Date 0.62 0.17 0.18 0.02 0.22 0.23 0.29 0.29 0.27 2.28 MW To Date 1.30 0.00 1.30 MW To Date 0.03 1.57 0.00 0.23 0.94 1.06 4.09 7.91 Percentage 24% 13% 31% 18% 12% 35% 29% 5% 14% Participant Type Customers Customers Customers Participants Products Sold Apt Units Apt Units Customers Customers Participants To Date 817 124 125 984 19,691 531 400 14 23 3,018 MWh To Date 1,112.49 233.33 289.76 127.27 1,212.31 508.55 806.93 922.96 627.23 5,840.82 Rebate Budget $ 1,500,000 $ 1,600,000 $ 2,577,000 $ 200,000 $ 1,000,000 $ 900,000 $ 1,800,000 $ 2,250,000 $ 1,100,000 $ 12,927,000 Spent to Date $ $ $ $ $ $ $ $ $ $ 290,966 300,492 337,217 142,588 186,494 170,301 435,959 186,116 243,732 2,293,864 Percentage 20% 0% Participant Type Devices Customers Participants To Date 920 0 920 MWh To Date 0 0 0.00 Rebate Budget $ 1,499,910 $ 2,000,000 $ 3,499,910 $ $ $ 159,890 463,464 623,354 Percentage 7% 25% 0% 15% 13% 13% 28% Participant Type Customers Customers Customers Dwellings Dwellings 1,000 sf 1,000 sf Participants To Date 50 1,210 0 218 1,568 634 3,545 3,046 MWh To Date 56 2,049 0 369 2,455 2,921 11,370 19,221 Rebate Budget $ - $ - $ 80,360 $ - $ - $ - $ - $ 80,360 Spent to Date $ - $ - $ - $ - $ - - $ $ - $ - MW Goal 62.95 MW To Date 11.49 Percentage Participant Type Participants To Date 6,984 MWh To Date 25,062.02 Rebate Budget $ 16,507,270 Spent to Date $ 2,917,218 21.08 41.31 4.62 6.88 24,852 6,002 6395.91 18666.11 $ $ 11,076,910 5,350,000 $ $ 2,023,905 893,312 Thermal Energy Storage TOTAL 0.00 0.00 0 0 $ - $ - 2/9/2022 Unaudited data updated monthly, as reported by CES teams. 1 of 3 Customer Energy Solutions FY22 YTD MW Savings Report As of December 2021 Customer Renewable Solutions Residential Commercial Unincentivized Solar Energy TOTAL MW Goal 7.00 5.00 12.00 MW To Date 1.55 0.12 0.70 2.37 Percentage 22% 2% Participant Type Customers Customers Participants To Date 186 2 110 298 MWh To Date 2,655 206 Incentive Budget $ 2,500,000 $ 2,750,000 Spent to Date $ $ 780,860 432,263 2,861.09 $ 5,250,000 $ 1,213,123 Participant Type Customers Customers Participants To Date 22,344 366 22,710 MWh To Date 42,777.84 147,912.12 190,689.96 Participant Type Customers Customers Participants To Date 238 156 394 MWh To Date 500.76 369.49 870.25 GreenChoice Residential Commercial GreenChoice TOTAL Community Solar Market Rate CAP Community Solar TOTAL Energy Efficiency Programs Solar Green Building Notes: AE Weatherization budget excludes rollover. All numbers are unaudited and will be adjusted in line with financial updates. Through December, 66% of Single Family homes receiving an AEGB rating are in SMART Housing developments in the AE service area. Two Multifamily SMART housing developments with a total of 218 units received AEGB ratings. 2/9/2022 Unaudited data updated monthly, as reported by CES teams. 2 of 3 MW Saving Goal Tracking Solar Goal Tracking 7.000 5.000 Customer Energy Solutions FY22 YTD MW Savings Report As of December 2021 62.95 8.00 7.00 6.00 5.00 4.00 3.00 2.00 1.00 0.00 1.55 1.10 0.30 0.00 0.06 0.12 70.00 60.00 50.00 40.00 30.00 20.00 10.00 0.00 11.49 8.29 3.22 Oct Nov Dec Jan Feb Mar Apr May Jun Jul Aug Sep Oct Nov Dec Jan Feb Mar Apr May Jun Jul Aug Sep Actual Goal Res Actual Com Actual Res Goal Com Goal 2/9/2022 Unaudited data updated monthly, as reported by CES teams. 3 of 3