Customer Energy Solutions FY21 Savings Report — original pdf
Backup
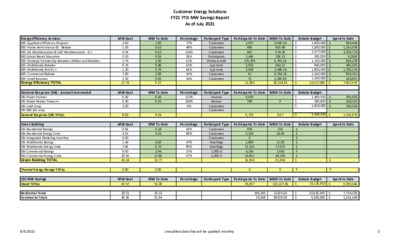
Customer Energy Solutions FY21 YTD MW Savings Report As of July 2021 Percentage 77% 48% 116% 26% 62% 65% 66% 41% 34% Percentage 132% 256% 0% 47% 86% 37% 87% Participant Type Customers Customers Customers Participants Products Sold Apt Units Apt Units Customers Customers Participant Type Devices Devices Customers Customers Participant Type Customers Customers Customers Dwellings Dwellings 1,000 sf 1,000 sf Energy Efficiency Services EES- Appliance Efficiency Program EES- Home Performance ES - Rebate EES- AE Weatherization & CAP Weatherization - D.I. EES-School Based Education EES- Strategic Partnership Between Utilities and Retailers EES- Multifamily Rebates EES- Multifamily WX-D.I.+ EES- Commercial Rebate EES- Small Business Energy Efficiency TOTAL Demand Response (DR) - Annual Incremental DR- Power Partner DR- Water Heater Timers++ DR- Load Coop DR- ERS (AE only) Demand Response (DR) TOTAL Green Building GB- Residential Ratings GB- Residential Energy Code GB- Integrated Modeling Incentive GB- Multifamily Ratings GB- Multifamily Energy Code GB- Commercial Ratings GB- Commercial Energy Code Green Building TOTAL Thermal Energy Storage TOTAL CES MW Savings Grand TOTAL Residential Totals Commercial Totals MW Goal 2.60 1.30 0.53 0.10 1.75 0.75 1.20 7.00 2.50 17.73 MW Goal 6.40 0.20 2.00 MW Goal 0.56 4.92 0.00 1.45 7.86 8.00 20.45 43.24 0.00 MW Goal 69.57 20.31 49.26 MW To Date 2.00 0.62 0.62 0.03 1.09 0.48 0.79 2.89 0.85 9.37 MW To Date 8.43 0.51 0.69 6.72 2.94 17.86 32.77 0.00 19.13 31.94 8.60 8.94 MW To Date 0.24 4.32 Percentage 43% 88% Participants To Date MWh To Date Participants To Date MWh To Date 2,937 486 481 1,445 175,799 2,823 3,950 91 71 12,284 5,935 788 6,723 305 3,334 0 1,890 11,321 4,234 15,961 16,850 0 3,918.42 865.48 974.76 186.31 6,795.16 984.27 2,448.34 9,754.76 2,296.88 28,224.36 Rebate Budget $ 1,800,000 $ 1,000,000 $ 2,377,000 $ 200,000 $ 1,150,000 $ 900,000 $ 1,800,000 $ 2,250,000 $ 1,100,000 $ 12,577,000 Spent to Date $ $ $ $ $ $ $ $ $ $ 984,444 1,165,478 2,029,774 52,869 668,278 486,335 1,198,275 853,231 424,891 7,863,576 9 Rebate Budget $ 1,499,910 $ 200,000 $ 1,850,000 $ $ $ 768,420 420,232 338,318 8.67 $ 3,549,910 $ 1,526,970 376 5,645 2,118 17,537 7,550 48,768 81,994 Rebate Budget $ - $ - $ - $ - $ - $ - $ - $ - $ - 0 $ - $ - Participants To Date MWh To Date Spent to Date MW To Date 51.08 Percentage Participant Type Participants To Date MWh To Date 35,857 110,227.06 Rebate Budget $ 16,126,910 Spent to Date $ 9,390,546 198,283 33,568 22201.68 88025.38 $ $ 10,926,910 5,200,000 $ $ 7,774,105 1,616,440 8/9/2021 Unaudited data that will be updated monthly. 3 Customer Energy Solutions FY21 YTD MW Savings Report As of July 2021 MW Goal 7.00 5.00 12.00 MW To Date 5.23 2.64 3.05 10.92 Percentage 75% 53% Participant Type Customers Customers Participants To Date MWh To Date 8,829 4,312 Incentive Budget $ 2,500,000 $ 2,750,000 Spent to Date $ $ 2,002,938 1,463,740 13,140.92 $ 5,250,000 $ 3,466,678 806 16 460 1282 Participant Type Customers Customers Participant Type Customers Customers Participants To Date MWh To Date 23,791 365 24,156 247 180 427 91,059 299,199 390,258.04 1,286 1,312 2,597.52 Participants To Date MWh To Date Customer Renewable Solutions Residential Commercial Unincentivized Solar Energy TOTAL GreenChoice Residential Commercial GreenChoice TOTAL Community Solar Market Rate CAP Community Solar TOTAL Energy Efficiency Programs Solar Green Building In July, 3 of 22 Single Family homes receiving an AEGB rating are in SMART Housing developments in the AE service area. Notes: AE Weatherization budget excludes rollover. EES School-based education goal has been updated from 0.01 MW to 0.10 MW. Solar fluctuations between June and July are a function of unincentivized solar tracking. All numbers are unaudited and will be adjusted by year's end. 8/9/2021 Unaudited data that will be updated monthly. 3 Customer Energy Solutions FY21 YTD MW Savings Report As of July 2021 MW Saving Goal Tracking Solar Goal Tracking 80.00 70.00 60.00 50.00 40.00 30.00 20.00 0.00 51.08 41.99 38.11 34.24 30.02 25.98 21.12 16.10 10.00 5.26 10.17 70.02 10.00 9.00 8.00 7.00 6.00 5.00 4.00 3.00 2.00 1.00 0.00 5.92 4.81 4.10 3.63 9.07 8.28 2.64 7.000 5.000 2.27 1.59 1.59 0.61 0.08 0.08 0.08 0.24 0.24 0.24 0.24 0.24 0.24 Oct Nov Dec Jan Feb Mar Apr May Jun Jul Aug Sep Oct Nov Dec Jan Feb Mar Apr May Jun Jul Aug Sep Actual Goal Res Actual Com Actual Res Goal Com Goal 8/9/2021 Unaudited data that will be updated monthly. 3