Austin Water Monthly Report — original pdf
Backup

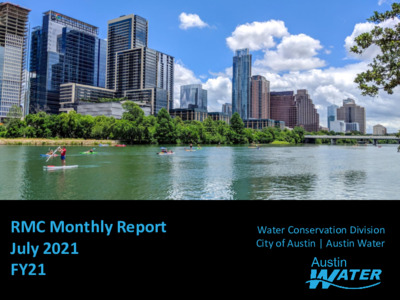
RMC Monthly Report July 2021 FY21 Water Conservation Division City of Austin | Austin Water s t i n U f o r e b m u N 700 600 500 400 300 200 100 0 Residential Program Participation, FYTD FY18 FY19 FY20 FY21 229 249 253 200 23 57 29 20 26 14 12 15 6 Watering Timer Home Water Use Monitoring Device Irrigation Upgrade Irrigation Audits Drought Survival Tools Rainwater Harvesting 153 114 108 69 59 155 119 122 127 21 13 11 15 WaterWise Landscape + Rainscape RMC Monthly Report – July 2021, FY21 02 s t i n U f o r e b m u N 60 50 40 30 20 10 0 Commercial & Multifamily Program Participation, FYTD FY18 FY19 FY20 FY21 54 17 8 11 1 0 3 2 2 2 0 0 1 1 Commercial Audit Commercial Process Rebates Commercial Kitchen Rebates Rainwater Harvesting RMC Monthly Report – July 2021, FY21 03 $450,000 $400,000 $350,000 $300,000 $ e v i t n e c n I $250,000 $200,000 $150,000 $100,000 $50,000 $0 Rebates and Incentives Budget, FYTD FY21 Total Budget Q1 Q2 Q3 Q4 $420,000 $245,000 $113,958.08 $65,000 $16,480.60 $- Commercial Commercial Multi-Family Multi-Family Residential Residential RMC Monthly Report – July 2021, FY21 04 800 700 600 500 400 300 200 100 0 Water Waste/Watering Restrictions Enforcement Activity, FYTD Warnings Issued and 311 Reports 707 322 234 220 41 244 261 173 186 120 79 15 12 72 83 128 60 4 1 0 Oct Nov Dec Jan Feb Mar Apr May Jun Jul Warnings 311 Reports Current Drought Response Stage: Conservation Stage RMC Monthly Report – July 2021, FY21 05 Regulated Compliance Program Activity, July 3083 3500 3000 2500 2000 1500 1000 500 0 223 180 27 232 61 Commercial Facility Irrigation Assessments Commercial Vehicle Wash Facility Efficiency Assessment Cooling Tower Efficiency Assessments Compliant Non-Compliant RMC Monthly Report – July 2021, FY21 06 Total Public Outreach Activity, FYTD Number of Events FY20 FY21 45 Populations Reached FY20 FY21 50 45 40 35 30 25 20 15 10 5 0 22 25,000 20,000 15,000 10,000 5,000 0 8,575 2 0 1,722 1,560 0 Community Events School Presentations Community Events School Presentations RMC Monthly Report – July 2021, FY21 07 Total Social Media Activity, FYTD Oct Nov Dec Jan Feb Mar Apr May Jun Jul s n o i t c a r e t n I f o r e b m u N 2,000,000 1,800,000 1,600,000 1,400,000 1,200,000 1,000,000 800,000 600,000 400,000 200,000 0 Facebook Twitter Monthly activity by platform Instagram RMC Monthly Report – July 2021, FY21 08 Reclaimed Water Usage 1,800.00 1,600.00 1,400.00 1,200.00 1,000.00 800.00 600.00 400.00 200.00 G M 0.00 Quarter IV Quarter III Quarter II Quarter I FY16 429.05 336.04 281.32 280.08 FY17 460.68 338.92 245.93 319.44 FY18 501.02 362.66 261.55 329.80 FY19 616.60 361.47 230.84 284.14 FY20 496.91 389.94 284.04 398.30 FY21 370.96 345.25 375.67 RMC Monthly Report – July 2021, FY21 09 Water Use - Gallons Per Capita Per Day (GPCD) FY08 170 D C P G 140 200 180 160 120 100 80 FY20 127 FY23 GOAL 119 FY28 GOAL 106 FY14 GPCD FY15 GPCD FY16 GPCD FY17 GPCD FY18 GPCD 5-year Avg GPCD baseline 10-year GPCD goal (FY28) Avg. annual % reduction from baseline 125 122 122 126 126 124 106 1.45% 2007 2012 Avg. GPCD Dry GPCD 2017 Wet GPCD 2022 Actual GPCD 2027 GPCD Goals RMC Monthly Report – July 2021, FY21 10 Multi-Year Daily Water Usage 2007 "Wet Year" 2011 "Dry Year" 2021 250.000 200.000 150.000 100.000 50.000 D G M , e g a s U 0.000 J a n F e b M a r A p r M a y J u n J u l A u g S e p O c t N o v D e c Month RMC Monthly Report – July 2021, FY21 11 System Water Loss Historical Water Loss Calendar Year (CY) Gallons (billions) Infrastructure Leakage Index (ILI) Loss in Gallons Per Capita per Day (GPCD) 23 2020 2019 2018 2017 2016 8.864 7.468 7.064 7.464 5.973 Water Loss (GPCD) ILI 18.9 3.68 4.44 3.91 3.84 4.21 3.31 19.3 3.84 19 19.4 21 17.1 11 2.6 Percent of Total Water Pumped 17.87% 15.57% 15.49% 16.42% 13.87% 11 2.4 Five & Ten-Year Water Loss Reduction Goals Historic 5- year Average Baseline CY 2024 Goal CY 2029 Goal RMC Monthly Report – July 2021, FY21 12 Lakes Buchanan and Travis Total Combined Storage Projections City of Austin Drought Contingency Plan Drought Response Stage Triggers: Conservation Stage: Above 1.4 MAF Stage I: 1.4 MAF Stage II: 900,000 AF Stage III: 600,000 AF Emergency Response Stage IV: Catastrophic event including prolonged drought Highland Lakes Storage summary as of June 4, 2021 Combined lake storage: 1.613 million acre feet Combined reservoir total: 80% RMC Monthly Report – July 2021, FY21 13 Water Conservation Division City of Austin | Austin Water