Multifamily & Commercial Project Pipeline Monthly Report — original pdf
Backup
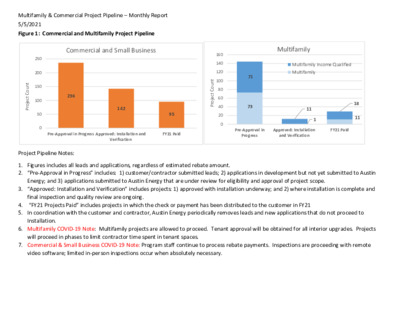
Multifamily & Commercial Project Pipeline – Monthly Report 5/5/2021 Figure 1: Commercial and Multifamily Project Pipeline Commercial and Small Business Multifamily 250 200 150 100 50 0 t n u o C t c e o r P j 236 142 95 160 140 120 100 80 60 40 20 0 t n u o C t c e o r P j 71 73 Multifamily Income Qualified Multifamily 11 1 18 11 Pre-Approval in Progress Approved: Installation and FY21 Paid Verification Pre-Approval in Progress Approved: Installation and Verification FY21 Paid Project Pipeline Notes: 1. Figures includes all leads and applications, regardless of estimated rebate amount. 2. “Pre-Approval in Progress” includes: 1) customer/contractor submitted leads; 2) applications in development but not yet submitted to Austin Energy; and 3) applications submitted to Austin Energy that are under review for eligibility and approval of project scope. 3. “Approved: Installation and Verification” includes projects: 1) approved with installation underway; and 2) where installation is complete and 4. 5. final inspection and quality review are ongoing. “FY21 Projects Paid” includes projects in which the check or payment has been distributed to the customer in FY21 In coordination with the customer and contractor, Austin Energy periodically removes leads and new applications that do not proceed to Installation. 6. Multifamily COVID-19 Note: Multifamily projects are allowed to proceed. Tenant approval will be obtained for all interior upgrades. Projects will proceed in phases to limit contractor time spent in tenant spaces. 7. Commercial & Small Business COVID-19 Note: Program staff continue to process rebate payments. Inspections are proceeding with remote video software; limited in-person inspections occur when absolutely necessary. Multifamily & Commercial Project Pipeline – Monthly Report 5/5/2021 Table 1: Multifamily and Multifamily Income Qualified – Estimated RCA Project Pipeline (for estimated rebates >$62k) Program Latest Workflow Enrollment # Location Name Installation Address Council District Estimated kWh savings Estimated $ Incentive Measures Planned Estimated kW savings Installation 1213464 Bridge at Tech Ridge 7 77.0 321,434 $154,028 12800 CENTER LAKE DR 1 8100 N. MoPac Expressway Multifamily Income Qualified Multifamily Income Qualified Multifamily Income Qualified Multifamily Income Qualified Installation 1209470 Bridge at Terracina* 10 91.0 264,910 $153,023 Paid 1208176 701 Center Ridge 7 107 504,050 $192,325 Bridge at Center Ridge Multifamily Income Qualified Paid 1190789, 1198380, 1186819, 1205232 Bridge At Northwest Hills 3600 GREYSTONE DR 10 147 288,943 $238,199 Paid 1203275 8405 BENT TREE RD 10 98.3 231,788 $82,263 Multifamily Installation 1212346 8601 Anderson Mill 272 666,441 $231,549 6 7 68.9 328,210 $151,500 Multifamily 1205826, 1207373, 1207491 * projects in which the RCA Fact Sheet was submitted in a prior month’s report Lantower Tech Ridge* Paid 14233 The Lakes Blvd Bent Tree Apartments* Bexley Anderson Mill* Total # of Units 294 170 348 314 126 396 375 Lighting, Smart Thermostats, Advanced Power Strips, and HVAC Tune-Up Attic Insulation, Lighting, Smart Thermostats, HVAC Tune-Up, Water Saving Devices Lighting, Smart Thermostats, HVAC Tune-Up, Water Saving Devices Phase 1: Solar Screens (completed) Phase 2 (unoccupied) & Phase 3/4 (occupied): HVAC Tune-Up, Smart Thermostats, and lighting Air Conditioner Replacement, Lighting, Duct Sealing, and Smart Thermostats Duct Remediation & Sealing, Lighting, Smart Thermostats, and HVAC Tune-Up Smart Thermostats and HVAC Tune-Up Multifamily & Commercial Project Pipeline – Monthly Report 5/5/2021 Table 2: Commercial and Small Business – Estimated RCA Project Pipeline (for estimated rebates >$62k) Program Latest Workflow Enrollment Number Location Name Installation Address Council District Estimated kW savings Commercial (new construction) Paid 1211707 Bouldin Creek Commons* 2043 S LAMAR BLVD Commercial Paid 1179740 Atria Senior Living* Commercial Installation 1201470 Lowe’s #1948* 9306 GREAT HILLS TRL 12611 SHOPS PKWY Unit 200 * projects in which the RCA Fact Sheet was submitted in a prior month’s report 5 10 ETJ Estimated kWh savings Estimated $ Incentive 394.2 1,569,929 $64,851 Measures Planned HVAC, Lighting, Variable Frequency Drives, gearless non-regenerative elevators 220 839,176 $63,335 Lighting 234.4 664,837 $62,247 Lighting Notes: 1. Rebates, kW, and kWh are subject to change pending final installation scope and site inspections. 2. The above pipeline includes projects that, upon completion of the pre-installation inspection, exceed $62k in estimated rebates. RCA Fact Sheets will be provided for these projects based on the approved scope. Estimated kW and kWh savings include estimated transmission and distribution system losses. 3. MULTIFAMILY REBATE FACT SHEET Bridge at Tech Ridge Bridge at Tech Ridge Housing Authority City of Austin 12800 Center Lake Dr, Austin, Tx 78753 2007 Note: Data reflects the proposal scope prior to installation and is subject to change pending final installation and inspection. Property Name Customer Name Property Address Year Built Number of Rentable Units Housing Type Water Heater Type Average Rent per Floor Plan[1] 1BR $939, 2BR $1,240 294 Income Qualified - 501c not for profit. Owned by Housing Authority of the City of Austin. Gas Electric Utilization Intensity (EUI) Average Electric Utilization Intensity for cohort[2] Project and Rebate Total Project Costs - Estimated Total Rebate - Estimated % of Total Construction Costs Rebate per Unit - Estimated Note(s) 6.84 8.25 $154,028 $154,028 100% $523 Project Annual Savings at 100% Occupancy Kilowatts (kW) Saved - Estimated Kilowatt-hours (kWh) Saved - Estimated Annual Dollar Savings Per Unit - Estimated[3] $103 $/kW– Estimated Scope of Work 77 kW 321,434 kWh $1,991/kW Replace 4226 existing Incandescent, Candelabera, Spot or Linear Fluorescent lamps with a like number of LED lamps. Install 298Honeywell Lyric T-Series smart thermostats. Perform HVAC Tune-Up on 298 units with the total tonnage of 449 tons. Distribute 294 advanced power strips. Measure Lighting Smart Thermostats Advanced Power Strips HVAC Tune-Up Rebate Amount - Estimated $13,278 $44,700 $1,470 $94,580 Measures Performed - Last 10 Years at this property Duct sealing kW Saved - Estimated kWh Saved - Estimated $/kW Annual Dollar Savings Per Unit[4] $639 $1,722 $372 $3,548 20.8 25.9 3.9 26.7 13,216 148,707 55,838 103,673 Completion Date 8/23/2013 $4 $48 $18 $33 Rebate Amount $80,139 [1] Source: CoStar [2] Cohort Type is determined by the year the property is built and the heating type (either gas or electric) [3] Calculation based on 10 cents per kWh. [4] Energy (kWh) and dollars ($) saved per project varies by both the size of the project and the type of heating. Projects with electric heat generally have higher savings than projects with gas heat. MULTIFAMILY REBATE FACT SHEET Bridge at Northwest Hills Note: Data reflects final installation and inspection; some values may have changed since original proposal scope. Bridge at Northwest Hills Housing Authority City of Austin 3600 Greystone Dr 1BR $1,060, 2BR $1,456 Income Qualified - 501c not for profit. Property Name Customer Name Property Address Year Built Average Rent per Floor Plan[1] Number of Rentable Units Housing Type Water Heater Type Electric Utilization Intensity (EUI) Total Project Costs Total Rebate % of Total Construction Costs Rebate per Unit Note(s) Average Electric Utilization Intensity for cohort[2] Project and Rebate 1978 312 Gas 12.94 11.29 $253,509 $238,199 94% $763 Installed Attic Insulation on 83,000 square feet of roof + 6,038 sqft Kneewall insulation. Replaced 3527 existing Incandescent, Candelabera, Spot or Linear Fluorescent lamps with a like number of LED lamps. Installed 299 Honeywell Lyric T-Series smart thermostats. Performed HVAC Tune-Up on 300 units with the total tonnage of 427.5 tons. Project Annual Savings at 100% Occupancy Kilowatts (kW) Saved Kilowatt-hours (kWh) Saved $/kW– Estimated Annual Dollar Savings Per Unit[3] Scope of Work 147 kW 288,943 kWh $1,626/kW $87 Measure Rebate Amount kW Saved kWh Saved $/kW Annual Dollar Savings Per Unit[4] Attic Insulation Lighting Smart Thermostats HVAC Tune-Up $90,019 $16,302 $52,325 $79,553 78.2 16.9 26.1 25.4 Measures Performed - Last 10 Years at this property Tuneups, LED lighting, thermostats – vacant units only Solar screens Duct sealing 30,316 10,712 149,206 98,709 Completion Date 7/16/2020 7/2/2020 11/4/2011 $1,151 $968 $2,009 $3,135 $9 $3 $45 $30 Rebate Amount $5,856 $18,406 $77,932 [1] Source: CoStar [2] Cohort Type is determined by the year the property is built and the heating type (either gas or electric) [3] Calculation based on 10 cents per kWh. [4] Energy (kWh) and dollars ($) saved per project varies by both the size of the project and the type of heating. Projects with electric heat generally have higher savings than projects with gas heat. MULTIFAMILY REBATE FACT SHEET Bridge at Center Ridge Note: Data reflects final installation and inspection; some values may have changed since original proposal scope. Bridge at Center Ridge Housing Authority of the City of Austin (HACA) managed by Apartment Management Professionals (AMP) 701 Center Ridge Dr 348 Income Qualified - Owned by HOUSING AUTHORITY OF AUSTIN. 501c not for profit. Electric 2008 $1,020 10.58 8.25 $192,325 $192,325 100% $552 107 kW 504,050 kWh $1,804/kW $136 Property Name Customer Name Property Address Year Built Average Rent per Floor Plan[1] Number of Rentable Units Housing Type Water Heater Type Total Project Costs Total Rebate % of Total Construction Costs Rebate per Unit Note(s) Electric Utilization Intensity (EUI) Average Electric Utilization Intensity for cohort[2] Project and Rebate Project Annual Savings at 100% Occupancy Kilowatts (kW) Saved Kilowatt-hours (kWh) Saved $/kW– Estimated Annual Dollar Savings Per Unit[3] Scope of Work Power Strips Lighting Smart Thermostats HVAC Tune-Up $1,625 $22,972 $49,950 $111,590 Water Saving Devices $6,188 Measures Performed - Last 10 Years at this property [1] Source: CoStar Measure Rebate Amount kW Saved kWh Saved $/kW 4.37 29.76 29.01 30.99 12.48 61,725 22,059 166,172 120,529 $372 $772 $1,722 $3,601 $496 133,564 Completion Date Rebate Amount Annual Dollar Savings Per Unit[4] $17 $6 $45 $33 $36 [2] Cohort Type is determined by the year the property is built and the heating type (either gas or electric) [3] Calculation based on 10 cents per kWh. [4] Energy (kWh) and dollars ($) saved per project varies by both the size of the project and the type of heating. Projects with electric heat generally have higher savings than projects with gas heat. Replaced 6032 existing Incandescent, Candelabera, Spot or Linear Fluorescent lamps with a like number of LED lamps. Installed 333 Honeywell Lyric T-Series smart thermostats. Perform HVAC Tune-Up on 333 units with the total tonnage of 522 tons. Distribute 325 power strips