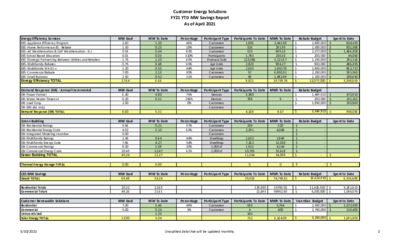
Customer Energy Solutions FY21 Savings Report — original pdf
Backup

Customer Energy Solutions FY21 YTD MW Savings Report As of April 2021 Percentage 46% 18% 82% 320% 63% 65% 44% 30% 21% Percentage 75% 256% 0% 44% 54% 20% 61% Participant Type Customers Customers Customers Participants Products Sold Apt Units Apt Units Customers Customers Participant Type Devices Devices Customers Customers Participant Type Customers Customers Customers Dwellings Dwellings 1,000 sf 1,000 sf Energy Efficiency Services EES- Appliance Efficiency Program EES- Home Performance ES - Rebate EES- AE Weatherization & CAP Weatherization - D.I. EES-School Based Education EES- Strategic Partnership Between Utilities and Retailers EES- Multifamily Rebates EES- Multifamily WX-D.I.+ EES- Commercial Rebate EES- Small Business Energy Efficiency TOTAL Demand Response (DR) - Annual Incremental DR- Power Partner DR- Water Heater Timers++ DR- Load Coop DR- ERS (AE only) Demand Response (DR) TOTAL Green Building GB- Residential Ratings GB- Residential Energy Code GB- Integrated Modeling Incentive GB- Multifamily Ratings GB- Multifamily Energy Code GB- Commercial Ratings GB- Commercial Energy Code Green Building TOTAL Thermal Energy Storage TOTAL CES MW Savings Grand TOTAL Residential Totals Commercial Totals Customer Renewable Solutions Residential Commercial Unincentivized Solar Energy TOTAL MW Goal 2.60 1.30 0.53 0.01 1.75 0.75 1.20 7.00 2.50 17.64 MW Goal 6.40 0.20 2.00 MW Goal 0.56 4.92 0.00 1.45 7.86 8.00 20.45 43.24 0.00 MW Goal 69.48 20.22 49.26 MW Goal 7.00 5.00 12.00 MW To Date 1.20 0.23 0.44 0.03 1.10 0.48 0.53 2.13 0.52 6.66 MW To Date 4.80 0.51 0.64 4.27 1.59 12.47 22.27 0.00 12.63 21.61 MW To Date 3.46 0.24 1.35 5.04 8.60 5.31 MW To Date 0.21 3.10 Percentage 37% 63% 1,836 326 323 1,783 113,386 2,823 2,635 57 38 9,821 3,380 788 4,168 259 2,391 1,632 7,262 1,921 10,783 11,544 0 533 4 185 722 Participants To Date MWh To Date Participants To Date MWh To Date 2,441.88 291.99 685.13 230.33 5,121.67 984.27 1,650.78 6,850.31 1,482.99 19,739.35 Rebate Budget $ 1,800,000 $ 1,500,000 $ 2,377,000 $ 200,000 $ 1,150,000 $ 900,000 $ 1,800,000 $ 2,250,000 $ 1,100,000 $ 13,077,000 Spent to Date $ $ $ $ $ $ $ $ $ $ 604,419 801,508 1,466,303 45,043 291,116 486,335 862,712 591,565 209,650 5,358,653 9 Rebate Budget $ 1,499,910 $ 200,000 $ 1,850,000 $ $ $ 472,915 231,261 253,860 8.67 $ 3,549,910 $ 958,036 320 4,048 1,849 11,018 4,144 33,618 54,998 Rebate Budget $ - $ - $ - $ - $ - $ - $ - $ - $ - 0 $ - $ - Participants To Date MWh To Date Spent to Date MW To Date 34.24 Percentage Participant Type Participants To Date MWh To Date 25,533 74,745.61 Rebate Budget $ 16,626,910 Spent to Date $ 6,316,688 129,930 21,693 15783.01 58962.60 $ $ 11,426,910 5,200,000 $ $ 5,261,613 1,055,075 Percentage 49% 5% Participant Type Customers Customers Participants To Date MWh To Date 5,764 400 Incentive Budget $ 2,500,000 $ 2,750,000 Spent to Date $ $ 1,572,500 119,403 6,164.09 $ 5,250,000 $ 1,691,903 5/10/2021 Unaudited data that will be updated monthly. 2 Customer Energy Solutions FY21 YTD MW Savings Report As of April 2021 Participant Type Customers Customers Participants To Date MWh To Date 22,179 360 22,539 87,570 304,893 392,462.82 UPDATE In April, 16 of 24 Single Family homes receiving an AEGB rating are in SMART Housing developments in the AE service area. GreenChoice Residential Commercial GreenChoice TOTAL Low Income Energy Efficiency Programs Solar Green Building Notes: AE Weatherization budget excludes rollover. 80.00 70.00 60.00 50.00 40.00 30.00 20.00 0.00 34.24 30.02 25.98 21.12 16.10 10.00 5.26 10.17 MW Saving Goal Tracking Solar Goal Tracking 70.02 8.00 7.00 6.00 5.00 4.00 3.00 2.00 1.00 0.00 4.81 4.10 3.63 2.27 1.59 1.59 0.61 0.08 0.08 0.08 0.24 0.24 0.24 0.24 7.000 5.000 Oct Nov Dec Jan Feb Mar Apr May Jun Jul Aug Sep Oct Nov Dec Jan Feb Mar Apr May Jun Jul Aug Sep Actual Goal Res Actual Com Actual Res Goal Com Goal 5/10/2021 Unaudited data that will be updated monthly. 2