Customer Energy Solutions FY21 MW Savings Report — original pdf
Backup
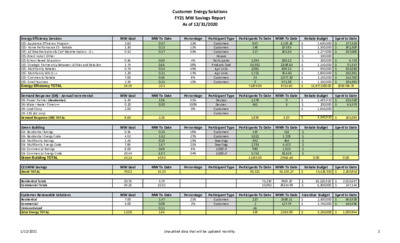
Customer Energy Solutions FY21 MW Savings Report As of 12/31/2020 22% 11% 33% 4% 38% 45% 17% 8% 10% 31% 150% 0% 18% 27% 13% 21% 8% 34% Customers Customers Customers Houses Participants Products Sold Apt Units Apt Units Customers Customers Devices Devices Customers Customers Customers Customers Dwellings Dwellings 1,000 sf 1,000 sf MW Goal MW To Date Percentage Participant Type Participants To Date MWh To Date Rebate Budget Energy Efficiency Services EES- Appliance Efficiency Program EES- Home Performance ES - Rebate EES- AE Weatherization & CAP Weatherization - D.I. EES-Direct Install -Other EES-School Based Education EES- Strategic Partnership Between Utilities and Retailers EES- Multifamily Rebates EES- Multifamily WX-D.I.+ EES- Commercial Rebate EES- Small Business Energy Efficiency TOTAL Demand Response (DR) - Annual Incremental DR- Power Partner (Residential) DR- Water Heater Timers++ DR- Load Coop DR- ERS (AE only) Demand Response (DR) TOTAL Green Building GB- Residential Ratings GB- Residential Energy Code GB- Multifamily Ratings GB- Multifamily Energy Code GB- Commercial Ratings GB- Commercial Energy Code Green Building TOTAL CES MW Savings Grand TOTAL Residential Totals Commercial Totals Customer Renewable Solutions Residential Commercial Unincentivized Solar Energy TOTAL 2.60 1.30 0.52 0.56 1.75 0.75 1.20 7.00 2.50 18.18 6.40 0.20 2.00 8.60 0.56 4.92 1.45 7.86 8.00 20.45 43.24 20.76 49.26 7.00 5.00 12.00 0.57 0.15 0.17 0.03 0.66 0.34 0.21 0.56 0.24 2.92 1.96 0.30 2.26 0.10 1.32 0.19 1.67 0.68 6.97 10.93 16.10 5.79 10.31 1.47 0.08 0.11 1.66 1,119.26 197.83 264.55 180.22 2,848.64 609.13 764.40 2,077.20 671.38 8732.60 $ 1,600,000 $ 1,500,000 $ 1,277,000 $ 100,000 $ 200,000 $ 1,150,000 $ 900,000 $ 1,800,000 $ 2,250,000 $ 1,100,000 $ 11,877,000.00 0 5 $ 1,499,910 $ 200,000 $ 1,850,000 Spent to Date $ 277,525 $ 392,509 357,068 $ $ $ $ $ $ $ 6,723 91,357 334,030 353,391 142,760 104,385 2059748.79 Spent to Date $ 135,520 $ 65,573 5.07 $ 3,549,910 $ 201,093 152 1,728 464 4,472 1,925 18,625 $ - $ - $ - $ - $ - $ - 11189.00 27366.60 0.00 0.00 847 148 117 1,394 65,952 2,081 1,721 24 9 72293.00 1,378 461 1,839 119 1,021 592 2,735 980 5,742 227 2 46 229 MW Goal MW To Date Percentage Participant Type Participants To Date MWh To Date Rebate Budget MW Goal MW To Date Percentage Participant Type Participants To Date MWh To Date Rebate Budget Spent to Date MW Goal 70.02 MW To Date Percentage Participant Type Participants To Date MWh To Date Rebate Budget 85,321 36,104.27 $ 15,426,910 Spent to Date $ 2,260,842 75,239 10,082 7869.29 28234.98 $ $ 10,226,910 5,200,000 $ $ 2,013,697 247,145 MW Goal MW To Date Percentage Participant Type Participants To Date MWh To Date 21% 2% Customers Customers 2438.11 127.79 Incentive Budget $ 2,500,000 $ 2,750,000 Spent to Date $ 565,928 $ 443,936 2,565.90 $ 5,250,000 $ 1,009,864 1/12/2021 Unaudited data that will be updated monthly. 2 Customer Energy Solutions FY21 MW Savings Report As of 12/31/2020 Participant Type Participants To Date MWh To Date Customers Customers 20099 350 20449 37957.78 134855.33 172,813.10 UPDATE GreenChoice Residential Commercial GreenChoice TOTAL Low Income Energy Efficiency Programs Solar Green Building 80.00 70.00 60.00 50.00 40.00 30.00 20.00 0.00 16.10 10.17 10.00 5.26 In December, 7 of 22 Single Family homes receiving an AE Green Building rating are in SMART Housing developments in the AE service area. One Multifamily SMART housing development with 240 units received a 1-star rating. MW Saving Goal Tracking Solar Goal Tracking 70.02 8.00 7.00 6.00 5.00 4.00 3.00 2.00 0.00 1.59 1.59 1.00 0.61 0.08 0.08 0.08 7.000 5.000 Oct Nov Dec Jan Feb Mar Apr May Jun Jul Aug Sep Oct Nov Dec Jan Feb Mar Apr May Jun Jul Aug Sep Actual Goal Res Actual Com Actual Res Goal Com Goal 1/12/2021 Unaudited data that will be updated monthly. 2