Multi Family and Commercial Pipeline — original pdf
Backup
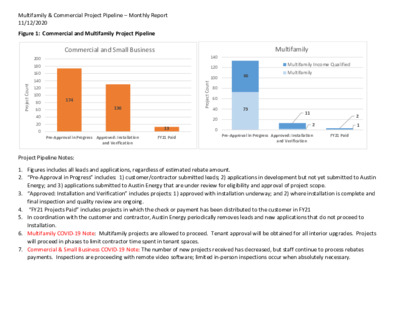
t n u o C t c e o r P j 140 120 100 80 60 40 20 0 60 73 Multifamily & Commercial Project Pipeline – Monthly Report 11/12/2020 Figure 1: Commercial and Multifamily Project Pipeline Commercial and Small Business Multifamily Multifamily Income Qualified Multifamily 200 180 160 140 120 100 80 60 40 20 0 t n u o C t c e o r P j 174 130 Pre-Approval in Progress Approved: Installation FY21 Paid and Verification Pre-Approval in Progress Approved: Installation FY21 Paid and Verification 13 11 2 2 1 Project Pipeline Notes: 1. Figures includes all leads and applications, regardless of estimated rebate amount. 2. “Pre-Approval in Progress” includes: 1) customer/contractor submitted leads; 2) applications in development but not yet submitted to Austin Energy; and 3) applications submitted to Austin Energy that are under review for eligibility and approval of project scope. 3. “Approved: Installation and Verification” includes projects: 1) approved with installation underway; and 2) where installation is complete and final inspection and quality review are ongoing. 4. “FY21 Projects Paid” includes projects in which the check or payment has been distributed to the customer in FY21 5. In coordination with the customer and contractor, Austin Energy periodically removes leads and new applications that do not proceed to Installation. 6. Multifamily COVID-19 Note: Multifamily projects are allowed to proceed. Tenant approval will be obtained for all interior upgrades. Projects will proceed in phases to limit contractor time spent in tenant spaces. 7. Commercial & Small Business COVID-19 Note: The number of new projects received has decreased, but staff continue to process rebates payments. Inspections are proceeding with remote video software; limited in-person inspections occur when absolutely necessary. Program Multifamily Income Qualified Multifamily Income Qualified Multifamily Income Qualified Multifamily & Commercial Project Pipeline – Monthly Report 11/12/2020 Table 1: Multifamily and Multifamily Income Qualified – Estimated RCA Project Pipeline (for estimated rebates >$62k) Latest Enrollment Workflow # Location Name Installation Address Council District Estimated kW savings Estimated kWh savings Estimated $ Incentive Measures Planned Installation 1203275 Bent Tree Apartments* 10 98.3 231,788 $82,263 Installation 1203807 Huntington Meadows 1 56.3 206,305 $97,860 8405 BENT TREE RD 7000 DECKER LN 3600 GREYSTONE DR 1137 GUNTER ST 1930 W RUNDBERG LN 4700 N CAPITAL OF TEXAS HWY SB 4701 STAGGERBRUSH RD 14233 The Lakes Blvd 1 4 8 7 Multifamily Income Qualified Paid 1190789, 1198380, 1186819 Bridge At Northwest Hills 10 102.8 274,064 $172,999 Paid 1183402 Lupine Terrace 34.8 131,144 $62,724 Multifamily Paid 1184360 Iron Horse Flats 47.2 168,917 $85,779 Multifamily Installation Nalle Woods* 10 57.0 263,247 $98,886 1190747, 1205154 1201740, 1201741, 1190308 1205826, 1207373, 1207491 Multifamily Installation Monterrey Ranch 194.4 33,247 $107,410 Solar Screens 1,070 Multifamily Installation Lantower Tech Ridge 68.9 328,210 $151,500 Smart Thermostats and HVAC Tune-Up 375 (footnotes located on next page) Total # of Units 126 200 314 140 200 238 Air Conditioner Replacement and Smart Thermostats Lighting, Smart Thermostat, HVAC Tune-Up Phase 1: Solar Screens (completed) Phase 2 (unoccupied) & Phase 3 (occupied): HVAC Tune-Up, Smart Thermostats, and lighting Lighting, Smart Thermostat, HVAC Tune-Up, Lighting, Smart Thermostats, HVAC Tune-Up Phase 1 (unoccupied) and Phase 2 (occupied): HVAC Tune-Up and Smart Thermostats Multifamily & Commercial Project Pipeline – Monthly Report 11/12/2020 Table 2: Commercial and Small Business – Estimated RCA Project Pipeline (for estimated rebates >$62k) Program Latest Workflow Enrollment Number Location Name Installation Address Council District Estimated kW savings Estimated kWh savings Estimated $ Incentive Measures Planned Commercial Installation 1195942 Costco* Commercial Installation 1179740 Atria Senior Living* Commercial Installation 1201470 Lowe’s #1948* 4301 W WILLIAM CANNON DR A 9306 GREAT HILLS TRL 12611 SHOPS PKWY Unit 200 8 10 ETJ 252 220 713,089 $ 62,488 Lighting 839,176 $63,335 Lighting 234.4 664,837 $62,247 Lighting Notes: 1. * indicates projects in which the RCA Fact Sheet was previously submitted 2. Rebates, kW, and kWh are subject to change pending final installation scope and site inspections. 3. The above pipeline includes projects that, upon completion of the pre-installation inspection, exceed $62k in estimated rebates. RCA Fact Sheets will be provided for these projects based on the approved scope. 4. Estimated kW and kWh savings include estimated transmission and distribution system losses. MULTIFAMILY INCOME QUALIFIED REBATE FACT SHEET Huntington Meadows Note: Data reflects the proposal scope prior to installation and is subject to change pending final installation and inspection. Property Name Huntington Meadows Customer Name Property Address Year Built Average Rent per Floor Plan1 Number of Rentable Units Housing Type Water Heater Type Total Project Costs - Estimated Total Rebate - Estimated % of Total Construction Costs Rebate per Unit - Estimated Note(s) Electric Utilization Intensity (EUI) Average Electric Utilization Intensity for cohort 2 Project and Rebate 9.49 kwh/ft2 8.31 kwh/ft2 Decker Lane Partners LP 7000 DECKER LN 1998 1BR $900; 2BR $1,100; $3BR 1,250 Market rate & Income Restricted, Level C 200 Gas $97,860 $97,860 100% $489 Huntington Meadows will install smart thermostats, upgrade to LED lighting, and perform HVAC Tune-Up at 200 units. Project Annual Savings at 100% Occupancy Kilowatt (kW) Saved - Estimated Kilowatt-hours (kWh) - Estimated $/kW - Estimated Annual Dollar Savings Per Unit - Estimated3 Scope of Work Measure 56.3 kW 206,305 kWh $1,736 $97 Rebate Amount - Estimated kW Saved – Estimated kWh Saved – Estimated $/kW Annual Dollar Savings Per $30,300 $54,540 $13,020 $97,860 17.6 24.0 14.79 56.3 100,801 93,283 12,221 206,305 $1,722 $2,274 $880 $1,736 Unit4 $47 $44 $6 $97 Measures Performed in last 10 years at this property Completion Date Rebate Amount 10/20/2016 1/6/2017 $55,306 $56,320 Smart Thermostats HVAC Tune-Up Lighting Total Duct Remediation & Sealing Solar Screens 1 Source: CoStar 2 Cohort Type is determined by the year the property is built and the heating type (either gas or electric) 3 Calculation based on 10 cents per kWh 4 Energy (kWh) and dollars ($) saved per project varies by both the size of the project and the type of heating. Projects with electric heat generally have higher savings than projects with gas heat. MULTIFAMILY INCOME QUALIFIED REBATE FACT SHEET Note: Data reflects final installation and inspection; some values may have changed since original proposal scope. Property Name Customer Name Property Address Year Built Average Rent per Floor Plan1 Number of Rentable Units Housing Type Water Heater Type Electric Utilization Intensity (EUI) Average Electric Utilization Intensity for cohort 2 Project and Rebate Total Project Costs Total Rebate % of Total Construction Costs Rebate per Unit Bridge at Northwest Hills Bridge At Northwest Hills City of Austin Housing Authority 3600 Greystone Dr. 1978 1BR $987 | 2BR $1,326 314 Market Rate (non-profit owner) Electric 9.97 kwh/ft2 8.05 kwh/ft2 $182,432 $172,999 95% $551 102.8 kW 274,064 kWh $1,682/kW $82 Note(s) Project was divided into phases due to COVID-19. Property will receive solar screens, HVAC Tune-up, LED Lighting, and smart thermostats. Project Annual Savings at 100% Occupancy Kilowatt (kW) Saved Kilowatt-hours (kWh) $/kW Annual Dollar Savings Per Unit3 Scope of Work Solar Screens HVAC Tune-Up Lighting Smart Thermostat Total Measure Rebate Amount kW Saved kWh Saved $/kW Annual Dollar Savings Per Unit4 $18,406 $83,410 $16,758 $54,425 $172,999 32 26.3 17.5 27.1 102.8 5,469 102,288 11,113 155,194 274,064 $576 $3,172 $959 $2,008 $1,682 $2 $31 $3 $46 $82 Measures Performed in last 10 years at this property Completion Date Rebate Amount none 1 Source: CoStar 2 Cohort Type is determined by the year the property is built and the heating type (either gas or electric) 3 Calculation based on 10 cents per kWh 4 Energy (kWh) and dollars ($) saved per project varies by both the size of the project and the type of heating. Projects with electric heat generally have higher savings than projects with gas heat. MULTIFAMILY INCOME QUALIFIED REBATE FACT SHEET Lupine Terrace Note: Data reflects final installation and inspection; some values may have changed since original proposal scope. Property Name Lupine Terrace Lupine Terrace (formerly Mason Manor Apts) 1137 Gunter Street 1966 1BR $1,045; 2BR $1,122; 3BR $1,161 140 140 Low-Income Units, Section 8 Voucher Electric 9.55 kwh/ft2 7.67 kwh/ft2 Customer Name Property Address Year Built Average Rent per Floor Plan1 Number of Rentable Units Housing Type Water Heater Type Electric Utilization Intensity (EUI) Average Electric Utilization Intensity for cohort 2 Project and Rebate Total Project Costs Total Rebate % of Total Construction Costs Rebate per Unit Note(s) $62,724 $62,724 100% $448 34.8 kW 131,144 kwh $1,800/kW $88 Lupine Terrace will complete LED lighting retrofits, HVAC Tune-ups, and install smart thermostats in 140 units. Project Annual Savings at 100% Occupancy Kilowatt (kW) Saved Kilowatt-hours (kWh) $/kW Annual Dollar Savings Per Unit 3 Scope of Work Smart Thermostats HVAC Tune-Up Lighting Total Measure Rebate Amount kW Saved kWh Saved $/kW $19,350 $38,700 $4,674 $62,724 11.2 15.9 7.7 34.8 64,373 61,881 4,890 131,144 $1,722 $2,433 $608 $1,800 Annual Dollar Savings Per Unit4 $43 $42 $3 $88 Measures Performed in last 10 years at this property Completion Date Rebate Amount Duct Remediation & Sealing Water Saving Devices 3/29/2017 3/29/2017 $54,922 $2,519 1 Source: CoStar 2 Cohort Type is determined by the year the property is built and the heating type (either gas or electric) 3 Calculation based on 10 cents per kWh 4 Energy (kWh) and dollars ($) saved per project varies by both the size of the project and the type of heating. Projects with electric heat generally have higher savings than projects with gas heat. MULTIFAMILY REBATE FACT SHEET Iron Horse Flats Note: Data reflects final installation and inspection; some values may have changed since original proposal scope Year Built Property Name Customer Name Property Address Iron Horse Flats Iron Horse Apartments 1930 West Rundberg Lane, Austin, TX 78758 1985 1BR $1,021; 2BR $1,346 200 Market Rate Electric 9.99 kwh/ft2 Electric Utilization Intensity (EUI) Average Electric Utilization Intensity for cohort 2 10.99 kwh/ft2 Project and Rebate Average Rent per Floor Plan Number of Rentable Units1 Housing Type Water Heater Type Rebate per Unit Note(s) Iron Horse Flats will install LED lighting, smart thermostats and perform HVAC tune-up on 200 units. Project Annual Savings at 100% Occupancy Total Project Costs Total Rebate % of Total Construction Costs Kilowatt (kW) Saved Kilowatt-hours (kWh) $/kW - Estimated Annual Dollar Savings Per Customer - Estimated3 Scope of Work $85,779 $85,779 100% $429 47.2 kW 168,917kWh $1,817/kW $79 Measure Rebate Amount kW Saved kWh Saved $/kW Lighting Smart Thermostats HVAC Tune-Up Total $9,309 $32,550 $43,920 $85,779 8,678 92,817 67,422 168,917 13.7 16.2 17.3 47.2 None $682 $2,009 $2,534 $1,818 Measures Performed in last 10 years at this property Completion Date Rebate Amount Annual Dollar Savings Per Customer4 $4 $44 $32 $79 1 Source: ApartmentTrends.com (https://www.apartmenttrends.com/) 2 Cohort Type is determined by the year the property is built and the heating type (either gas or electric) 3 Calculation based on 10 cents per kWh 4 Energy (kWh) and dollars ($) saved per project varies by both the size of the project and the type of heating. Projects with electric heat generally have higher savings than projects with gas heat. Note: Data reflects the proposal scope prior to installation and is subject to change pending final installation and inspection. Property Name MULTIFAMILY REBATE FACT SHEET Monterey Ranch Monterey Ranch NORTHLAND MONTEREY RANCH LLC 4701 STAGGERBRUSH RD 1996 1BR $957 | 2BR $1,123 | 3BR1,357 1,070 Market rate Electric 10.19 kwh/ft2 10.89 kwh/ft2 Customer Name Property Address Year Built Average Rent per Floor Plan1 Number of Rentable Units Housing Type Water Heater Type Electric Utilization Intensity (EUI) Average Electric Utilization Intensity for cohort 2 Project and Rebate Total Project Costs - Estimated Total Rebate - Estimated % of Total Construction Costs Rebate per Unit - Estimated Note(s) Monterey Ranch will install solar screens for 476 units. Project Annual Savings at 100% Occupancy Kilowatt (kW) Saved - Estimated Kilowatt-hours (kWh) - Estimated $/kW - Estimated Annual Dollar Savings Per Unit - Estimated3 Scope of Work Measure TBD $107,411 TBD $100 194.4 kW 33,247 kWh $553/kW $3 Rebate Amount - Estimated kW Saved – Estimated kWh Saved – Estimated $/kW Annual Dollar Savings Per $107,411 194.4 33,247 $553 Unit4 $3 Measures Performed in last 10 years at this property Completion Date Duct Remediation & Sealing 12/20/2011 Rebate Amount $192,333 Solar Screens 1 Source: CoStar 2 Cohort Type is determined by the year the property is built and the heating type (either gas or electric) 3 Calculation based on 10 cents per kWh 4 Energy (kWh) and dollars ($) saved per project varies by both the size of the project and the type of heating. Projects with electric heat generally have higher savings than projects with gas heat. Note: Data reflects the proposal scope prior to installation and is subject to change pending final installation and inspection. Property Name Lantower Tech Ridge MULTIFAMILY REBATE FACT SHEET Lantower Tech Ridge Lantower Residential 14233 The Lakes Blvd 2016 1BR $987 | 2BR $1,326 375 Customer Name Property Address Year Built Average Rent per Floor Plan1 Number of Rentable Units Housing Type Water Heater Type Electric Utilization Intensity (EUI) Average Electric Utilization Intensity for cohort 2 Project and Rebate Total Project Costs - Estimated Total Rebate - Estimated % of Total Construction Costs Rebate per Unit - Estimated Note(s) Kilowatt (kW) Saved - Estimated Kilowatt-hours (kWh) - Estimated $/kW - Estimated Annual Dollar Savings Per Unit - Estimated3 Scope of Work Measure Market Rate Electric 9.07 kwh/ft2 7.67 kwh/ft2 TBD $151,500 TBD $404 68.9 kW 328,210 kWh $2,198/kW $82 Lantower Tech Ridge will install smart thermostats and perform HVAC Tune-Ups at 375 units. Project Annual Savings at 100% Occupancy Rebate Amount - Estimated kW Saved – Estimated kWh Saved – Estimated $/kW Annual Dollar Savings Per $95,250 $56,250 $151,500 36.3 32.7 68.9 141,079 187,131 328,210 Unit4 $35 $47 $82 $2,626 $1,722 $2,198 Measures Performed in last 10 years at this property Completion Date Rebate Amount HVAC Tune-Up Smart Thermostat Total n/a 1 Source: CoStar 2 Cohort Type is determined by the year the property is built and the heating type (either gas or electric) 3 Calculation based on 10 cents per kWh 4 Energy (kWh) and dollars ($) saved per project varies by both the size of the project and the type of heating. Projects with electric heat generally have higher savings than projects with gas heat.