Customer Energy Solutions Savings Report — original pdf
Backup
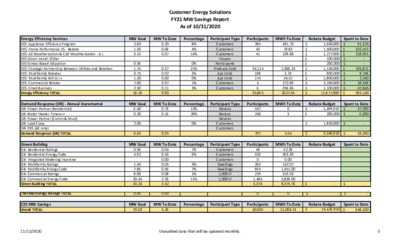
Customer Energy Solutions FY21 MW Savings Report As of 10/31/2020 Energy Efficiency Services EES- Appliance Efficiency Program EES- Home Performance ES - Rebate EES- AE Weatherization & CAP Weatherization - D.I. EES-Direct Install -Other EES-School Based Education EES- Strategic Partnership Between Utilities and Retailers EES- Multifamily Rebates EES- Multifamily WX-D.I.+ EES- Commercial Rebate EES- Small Business Energy Efficiency TOTAL Demand Response (DR) - Annual Incremental DR- Power Partner (Residential) DR- Water Heater Timers++ DR- Power Partner (Comm & Muni) DR- Load Coop DR- ERS (AE only) Demand Response (DR) TOTAL Green Building GB- Residential Ratings GB- Residential Energy Code GB- Integrated Modeling Incentive GB- Multifamily Ratings GB- Multifamily Energy Code GB- Commercial Ratings GB- Commercial Energy Code Green Building TOTAL Thermal Energy Storage TOTAL CES MW Savings Grand TOTAL MW Goal MW To Date Percentage Participant Type Participants MWh To Date Rebate Budget MW Goal MW To Date Percentage Participant Type Participants MWh To Date Rebate Budget 2.60 1.30 0.52 0.56 1.75 0.75 1.20 7.00 2.50 18.18 6.40 0.20 2.00 8.60 0.56 4.92 1.45 7.86 8.00 20.45 43.24 0.00 0.20 0.06 0.07 0.37 0.02 0.00 0.07 0.11 0.90 0.79 0.16 0.95 0.04 0.43 0.00 0.05 0.56 0.08 2.26 3.42 0.00 8% 4% 14% 0% 21% 3% 0% 1% 5% 12% 78% 0% 7% 9% 3% 7% 1% 11% Customers Customers Customers Houses Participants Products Sold Apt Units Apt Units Customers Customers Devices Devices Devices Customers Customers Customers Customers Customers Dwellings Dwellings 1,000 sf 1,000 sf 35,114 35,865 285 43 41 198 174 4 6 557 240 797 49 333 0 263 965 279 1,485 3,374 0 381.73 79.83 109.88 1,388.24 3.25 34.57 272.89 356.96 2627.34 $ 1,600,000 $ 1,500,000 $ 1,277,000 $ 100,000 $ 200,000 $ 1,150,000 $ 900,000 $ 1,800,000 $ 2,250,000 $ 1,100,000 $ 11,877,000 Spent to Date $ 91,325 $ 102,413 $ 218,031 - $ $ - $ $ $ $ $ $ 105,871 8,756 2,340 18,559 47,845 595,140 Spent to Date $ 47,390 6,000 $ 0 3 $ 1,499,910 $ 200,000 $ 1,850,000 $ - 2.64 $ 3,549,910 $ 53,390 62.28 563.39 0.00 142.07 1,451.00 319.03 5,838.00 8,375.76 $ - $ - 0 $ - $ - MW Goal MW To Date Percentage Participant Type Participants MWh To Date Rebate Budget Spent to Date MW Goal MW To Date Percentage Participant Type Participants MWh To Date Rebate Budget 70.02 5.26 40,036 11,005.74 $ 15,426,910 Spent to Date 648,530 $ 11/12/2020 Unaudited data that will be updated monthly. 3 Customer Energy Solutions FY21 MW Savings Report As of 10/31/2020 Energy Efficiency and DR Goal Tracking Residential Totals Commercial Totals Customer Renewable Solutions Residential Commercial Unincentivized Solar Energy TOTAL MW Goal MW To Date Percentage Participant Type Participants MWh To Date 37,034 3,002 2625.81 8379.94 Incentive Budget $ 10,226,910 5,200,000 $ Spent to Date $ 582,126 66,404 $ MW Goal MW To Date Percentage Participant Type Participants MWh To Date 9% 2% Customers Customers 100 2 102 1026.59 127.79 Incentive Budget $ 2,500,000 $ 2,750,000 Spent to Date $ 244,428 165,616 $ 1,154.38 $ 5,250,000 $ 410,044 20.76 49.26 7.00 5.00 12.00 2.13 3.13 0.61 0.08 0.69 GreenChoice Residential Commercial GreenChoice TOTAL Low Income Energy Efficiency Programs Solar Green Building Participant Participants To Type Customers Customers Date 19,721 1,833 21,554 MWh To Date 14,780.48 44,309.34 59,089.82 Notes: · Customer count includes all participants within the month of October (NOT as of Oct 31) · Commercial customer count treats each City of Austin account as individual customers · MWh includes the block amount (NOT total usage) for Patron block customers UPDATE In October, 21 of 49 Single Family homes receiving an AE Green Building rating are in SMART Housing developments in the AE service area. Two multifamily SMART housing developments received a 1-star rating: a low-rise with 263 units and a hi-rise with 166 units. 11/12/2020 Unaudited data that will be updated monthly. 3 Customer Energy Solutions FY21 MW Savings Report As of 10/31/2020 70.02 8.00 7.00 6.00 5.00 4.00 3.00 2.00 1.00 0.61 0.08 0.00 FY21 MW Saving Goal Tracking FY21 Solar Goal Tracking 7.000 5.000 80.00 70.00 60.00 50.00 40.00 30.00 20.00 0.00 10.00 5.26 Oct Nov Dec Jan Feb Mar Apr May Jun Jul Aug Sep Oct Nov Dec Jan Feb Mar Apr May Jun Jul Aug Sep Actual Goal Res Actual Com Actual Res Goal Com Goal 11/12/2020 Unaudited data that will be updated monthly. 3